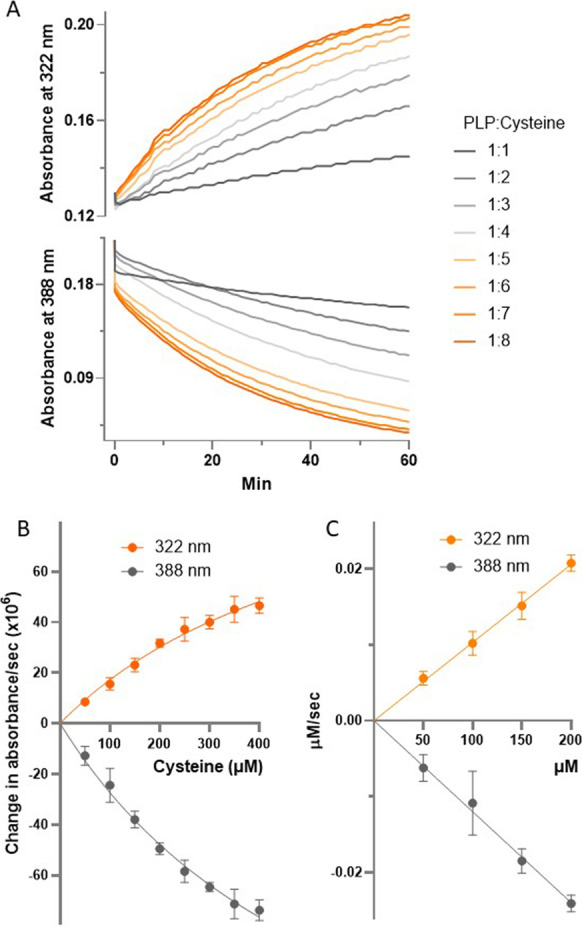
Fig. 8.

Determination of the rate constant for the reaction of cysteine and PLP. A The changes in absorbance at 322 and 388 nm due to reaction of 50 µM PLP and 50, 100, 150, 200, 250, 300, 350, and 400 µM cysteine (depicted as PLP:cysteine ratios: 1:1, 1:2, 1:3, 1:4, 1:5, 1:6, 1:7, and 1:8, respectively) are shown as a function of time. The data were extracted from scans such as those depicted in Fig. 7 and includes data taken from scans acquired first at 5 s and then at successive minute intervals following the initial mixing of PLP and cysteine. Because these traces would overlap on a contiguous Y axis, the Y axis was spilt into two regions to enable viewing of changes at 322 and 388 nm independently of each other. Each trace represents the mean of at least 4 data points. The mean ± SD (n) of these absorbances is presented in the Supplementary Table 3. The initial velocities of the data shown in A are depicted changes in optical density and concentrations over time in B and C, respectively
