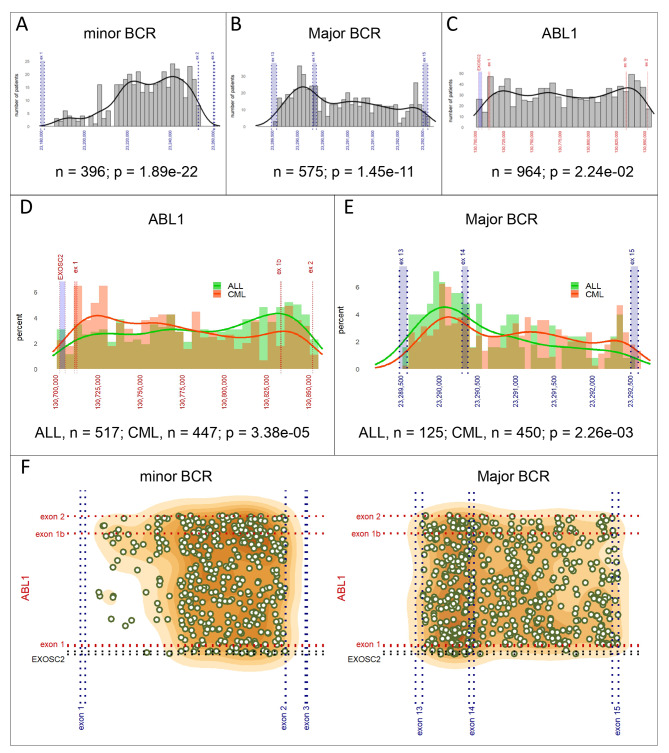
Fig. 1.
BCR and ABL1 breakpoint distribution. Breakpoint distribution within the minor BCR (A), Major BCR (B) and ABL1 (C) breakpoint areas; comparison of breakpoints distribution between ALL and CML patients within ABL1 (D) and Major BCR (E) areas; overall distribution of breakpoints and the relationship between breakpoint location on the ABL1 side and in the minor and Major BCR regions. Gene coordinates are given according to GRCh38/hg38. The uniformity of breakpoint site distribution was tested using Pearson’s Chi-Squared test, comparison of breakpoint distribution between the groups was tested using Kolmogorov-Smirnov test. Images adapted from the “Break-App” web tool

