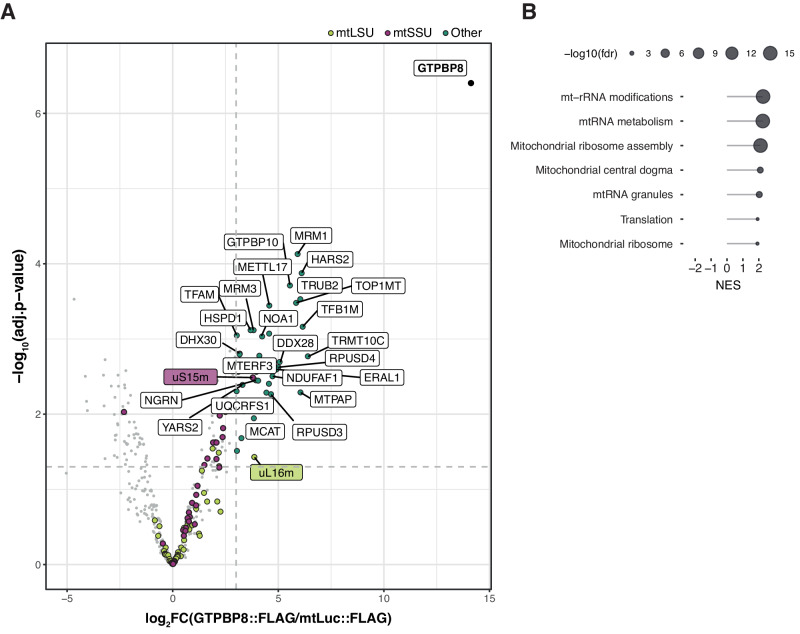
Fig. 1. GTPBP8 interacts with proteins involved in mt-rRNA metabolism and mitoribosome assembly.
A Label-free quantitative (LFQ) mass spectrometry analysis following FLAG-IP of GTPBP8::FLAG (n = 3 independent experiments). Eluates from mtLuc::FLAG (control) and GTPBP8::FLAG were used. The log2(fold change) and the -log10(adjusted p-value) are displayed on the x- and y-axis, respectively. MRPs from the mt-LSU (light green) and the mt-SSU (purple) are highlighted as well as other proteins above the threshold (turquoise). The dashed lines (light gray) represent the thresholds of the log2FC > 3 and -log10(adj.p-value) > 1.3 (adj.p-value < 0.05). The volcano plot was filtered for mitochondrial proteins as annotated in MitoCarta 3.0. A full annotation of the identified proteins is displayed in Supplementary Data 1. B GSEA analysis of the FLAG-IP results was performed using the Webgestalt R package. The enrichment score normalized (NES) is indicated together with the -log10 of the false discovery rate (FDR).

