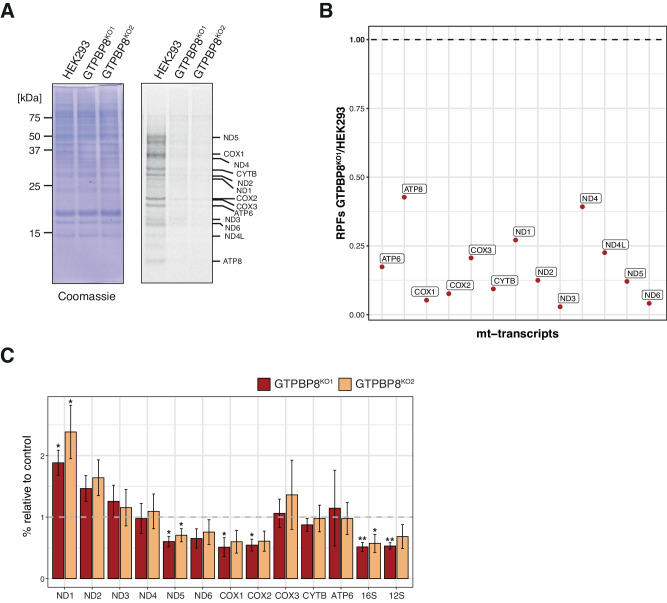
Fig. 3. Mitochondrial protein synthesis is decreased in the absence of GTPBP8.
A In vivo translation assay of GTPBP8KO1 and GTPBP8KO2 cell lines compared to HEK293. Cells were labeled with a [35S]-methionine and cysteine mix upon cytosolic translation inhibition. Whole cell lysates were resolved by SDS-PAGE and the signal was later detected via autoradiography. Loading was determined using Coomassie staining (n = 3 independent experiments). B Mitoribosome profiling analysis of GTPBP8KO1 compared to HEK293. The ratio of the mitoribosome-protected fragments (RPFs) in GTPBP8KO1 vs control for each mitochondrial transcript is represented on the y-axis. The data were determined via MitoRiboSeq and refer to a single experiment. C Quantitative real-time PCR of mt-mRNAs and mt-rRNAs steady-state levels in HEK293 cells depleted of GTPBP8 compared to control. Total RNA isolated from HEK293, GTPBP8KO1 and GTPBP8KO2 was used (n = 3 biological replicates, data presented as mean values ± 1 SD). Student’s two-tailed t-test was performed. P-values and source data are provided in a Source Data file. The significance cut-off was set at p < 0.05, with *p < 0.05, **p < 0.01, and ***p < 0.001. Source data are provided as a Source Data file.

