
Figure 4.
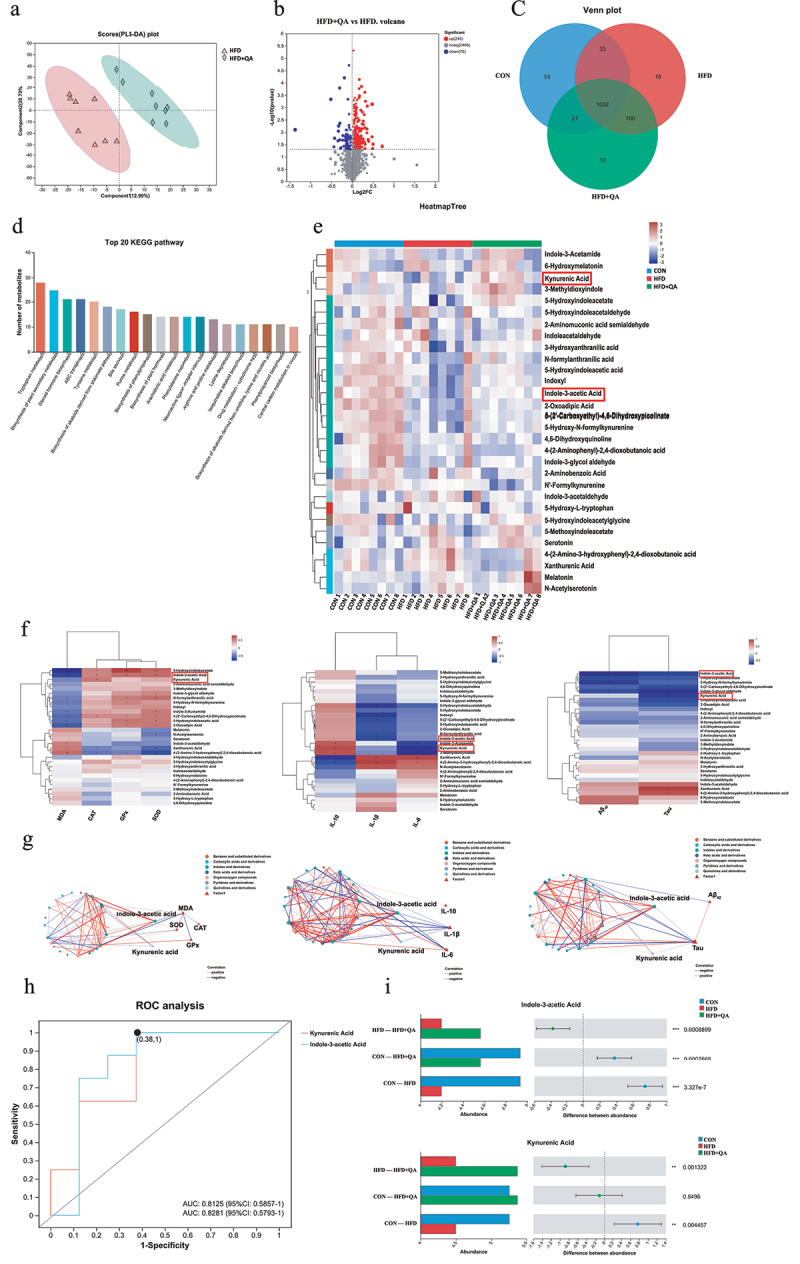
QA altered gut microbe-associated metabolites.
(a) PLS-DA of fecal metabolic profile. (b) Volcano map of significantly up- and down-regulated metabolites between HFD and HFD+QA group. (c) Wayne diagram. (d) KEGG pathway classification of metabolites. (e) Heatmap of differential tryptophan metabolites. (f) Correlation heatmap of tryptophan metabolites with oxidative stress indicators, inflammatory cytokines and AD indicators. (g) Ecological network among differential tryptophan metabolites with oxidative stress indicators, inflammatory cytokines and AD indicators. (h) ROC analysis of IAA and KYNA. (i) The abundance of IAA and KYNA in different groups. *p < .05, **p,< .01, ***p < .001. PLS-DA, Partial Least Squares Discrimination Analysis; ROC, Receiver Operating Characteristic; IAA, Indole-3-acetic acid; KYNA, Kynurenic acid.