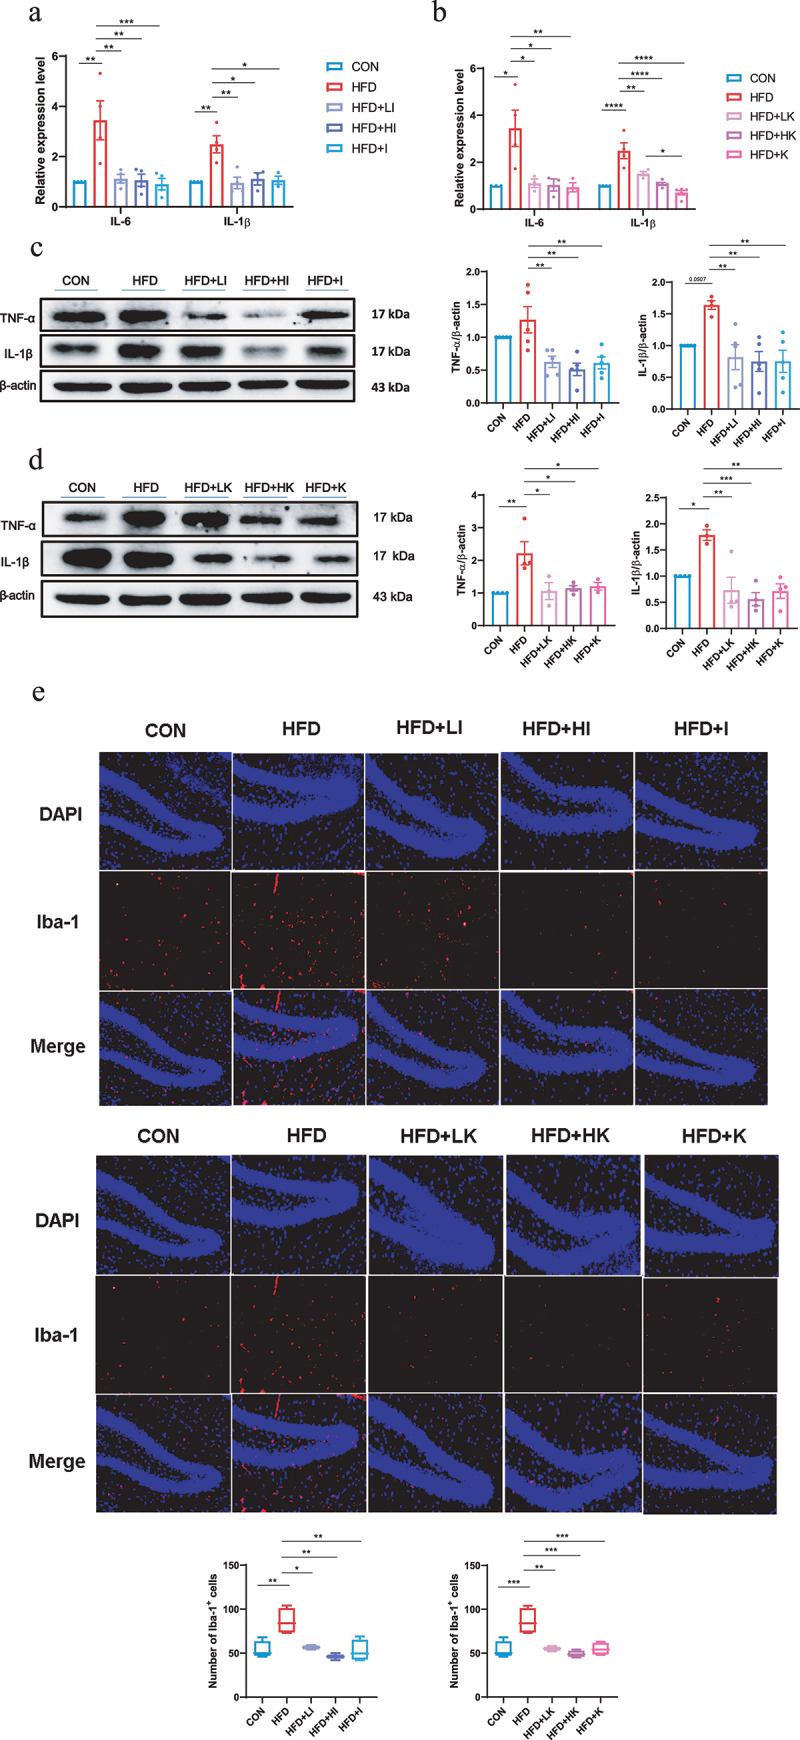
Figure 6.

IAA and KYNA ameliorated inflammation of HFD mice.
(a and b) The relative expression levels of inflammatory cytokines in the brain. (c and d) Protein levels of TNF-α and IL-1β in the brain of IAA and KYNA treated mice by western blot. (e) Immunofluorescence staining of Iba-1 on mice brain slices. Data are expressed as mean± SEM, *p < .05, **p < .01, ***p < .001.
