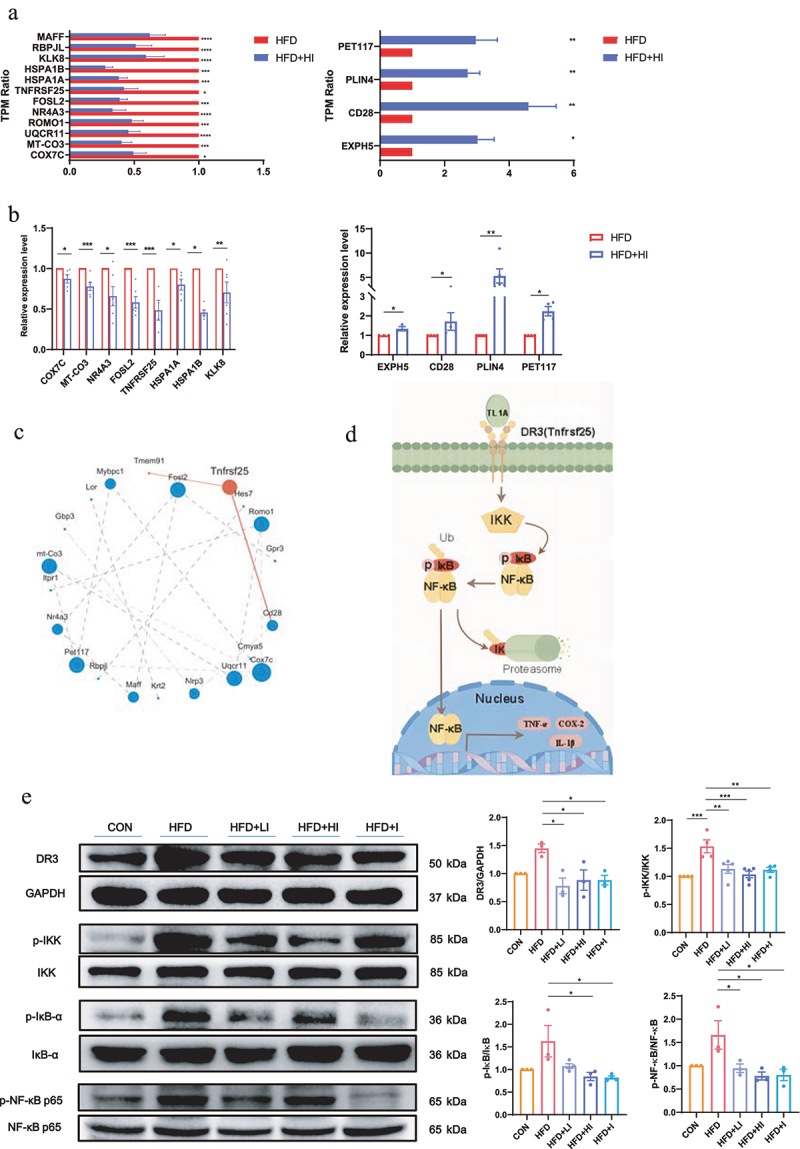
Figure 9.

IAA-regulated neuroinflammation via the NF-κB signaling pathway.
(a) The TPM ratio of up-regulated and down-regulated genes. (b) The expression levels of differential expression genes in the brain detected by QPCR. (c) Analysis of protein–protein interaction networks of differential expression genes. (d) Flow chart of NF-κB signaling pathway. (e) Protein levels of DR3, p-IKK/IKK, p-IκBα/IκBα and p-NF-κB/NF-κB in the brain detected by western blot. Data are expressed as mean±SEM, *p < .05, **p < .01, ***p < .001, ****p < .0001.
