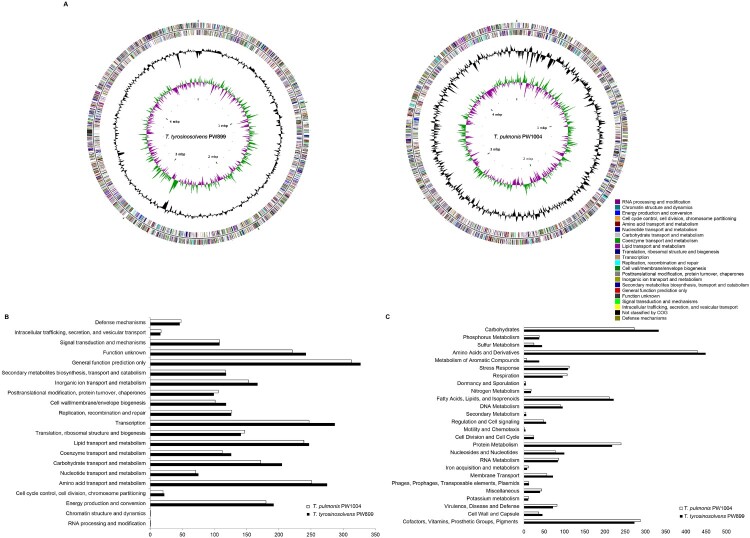
Figure 2.
Graphical circular maps of the genomes and the distributions of predicted coding sequence function according to COG and SEED subsystems. (a) T. tyrosinosolvens-PW899 (left) T. pulmonis-PW1004 (right). From outside to centre, ring 1 and 2 show protein coding genes on both the forward and reverse strand (coloured by COG categories, respectively); ring 3 shows G + C% content plot, and ring 4 shows GC skew, purple indicating negative values and green, positive values; The columns indicate the number of proteins in different (b) COG and (c) SEED subsystems.

