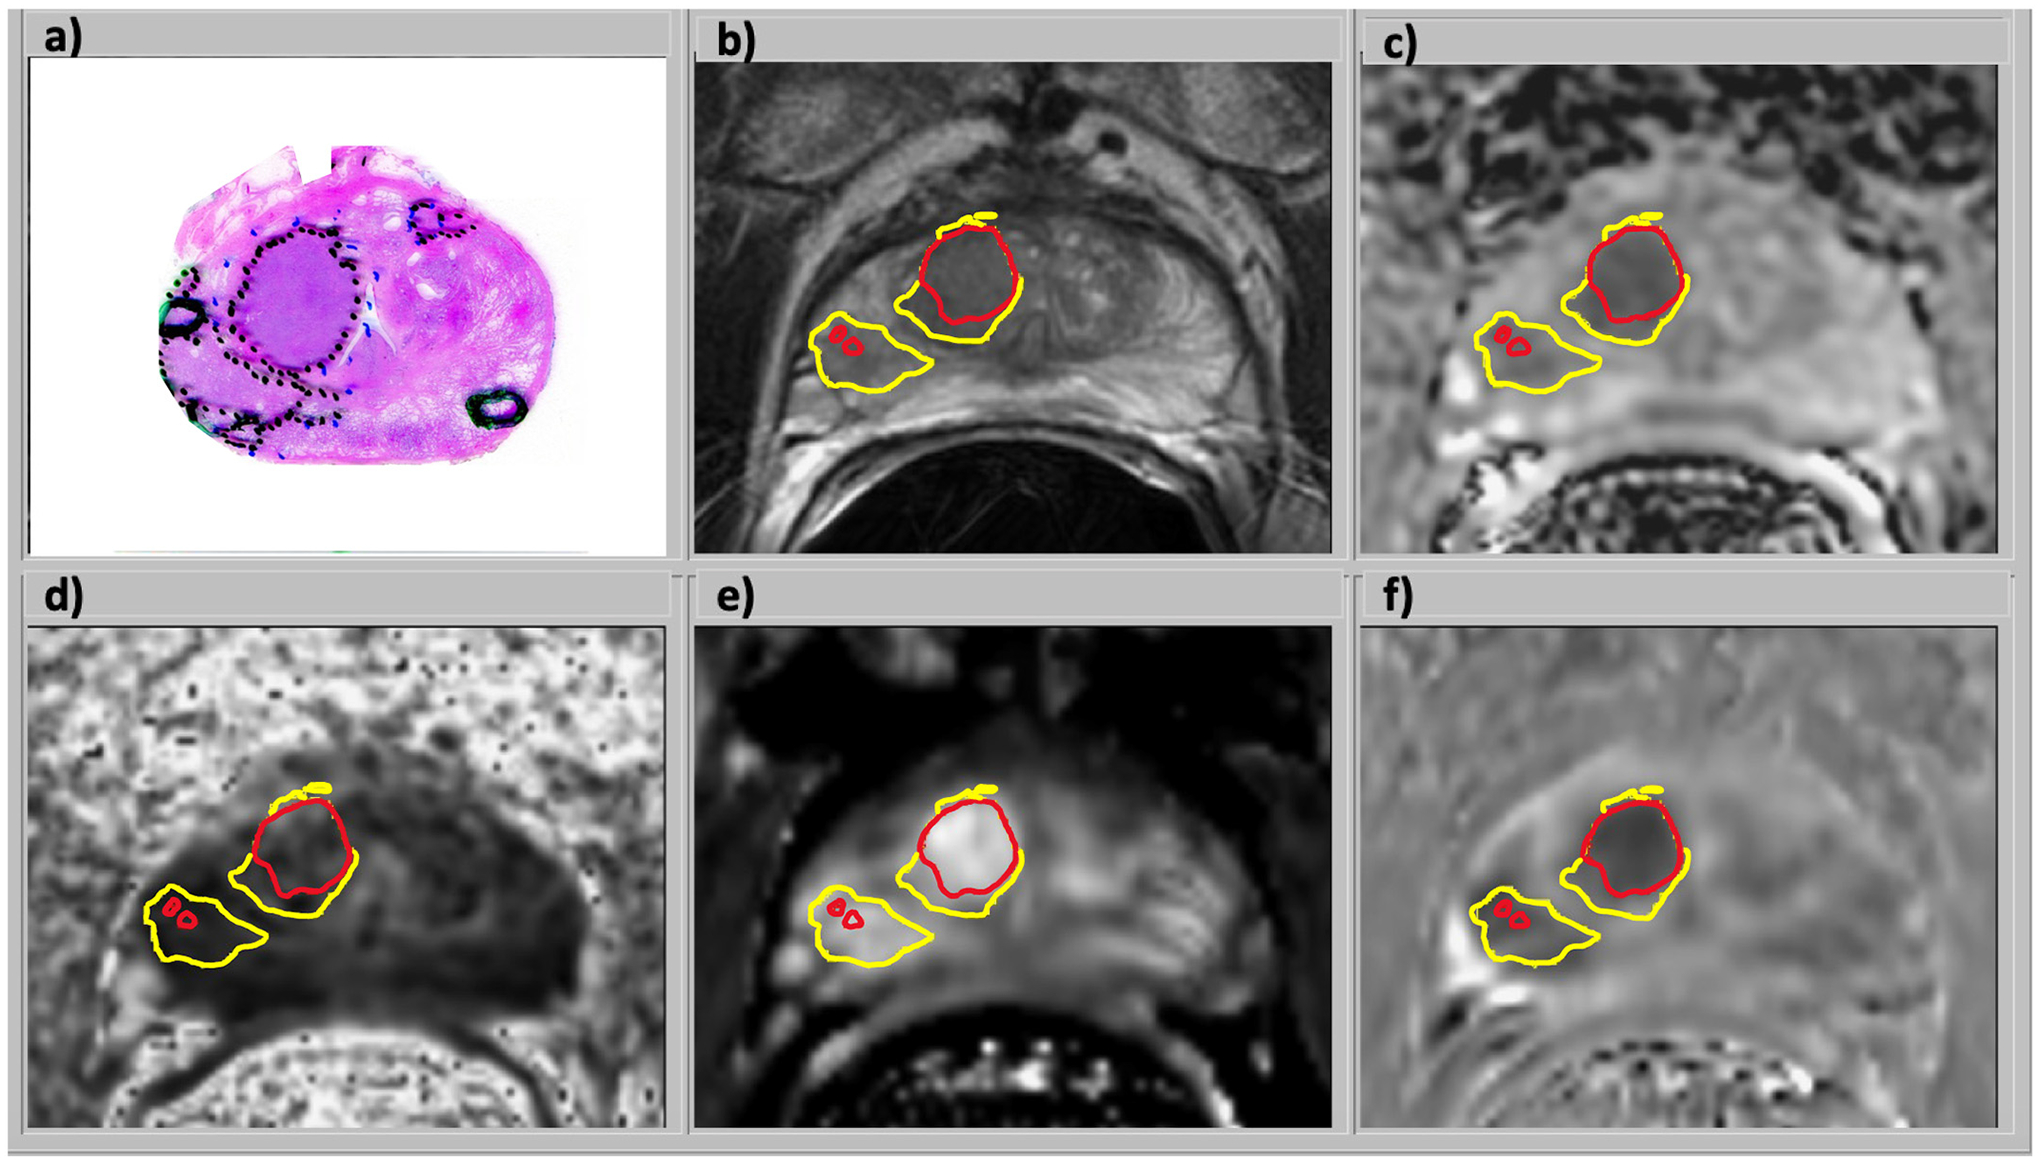
Fig. 3.

Images from a 70 year-old male with serum PSA of 9.8 ng/ml and GG3 prostate cancer who underwent radical prostatectomy: a) H&E stained histology specimen, b) coil-corrected T2-weighted FSE image, c) ADC map, d) fractional anisotropy map, e) DCE MRI enhancement slope, and f) DCE MRI washout slope. The mpMRI images were combined in a logistic regression model to generate the cancer risk maps in the TZ and the PZ. In this example, a combination of hypointense T2W, ADC, and DCE MRI washout plus hyperintense DCE MRI enhancement slope resulted in a high-risk region in the cancer maps and lesions identified by the outline of the cancer masks for all PCa (yellow) and aggressive PCa (red).
