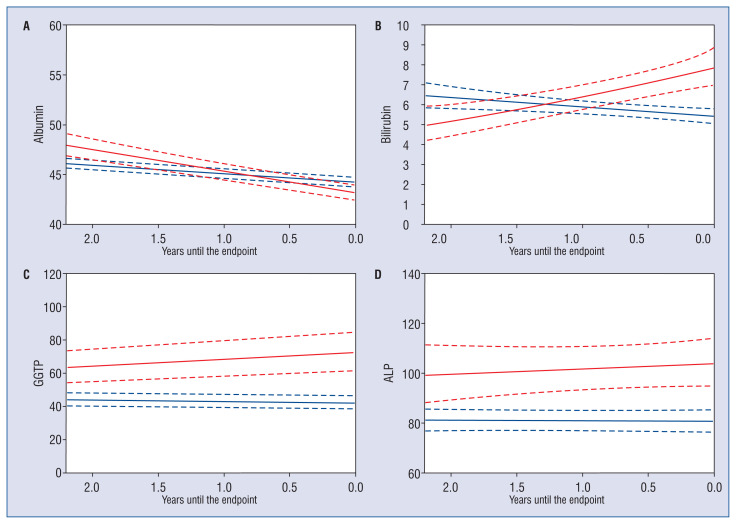
Figure 1.
Evolution plots of hepatic biomarkers based on the joint models. Average temporal evolution of biomarkers in patients during follow-up. Legend: x–axis — time remaining to the primary endpoint (for patients who experienced adverse events) or time remaining to the last blood sampling (for patients who remained event free). ‘Time zero’ is defined as the occurrence of the primary end point and is presented on the right side of the x-axis, so that the average biomarker trajectory may be visualized as the end point approaches (inherently to this representation, baseline sampling occurred before time zero). Y-axis — biomarker levels expressed in g/L for albumin, μmol/L for bilirubin and U/L for gamma-glutamyl transpeptidase (GGTP) and alkaline phosphatase (ALP). Solid red line — average temporal pattern of biomarker level in patients who reached the primary end point during follow-up. Solid blue line — average temporal pattern of biomarker level in patients who remained end point free. Betas presented for patients who reached the primary end point (red) and for patients who remained end point free (blue) per one year of follow-up based on linear mixed effects model. Dashed lines — 95% confidence interval.

