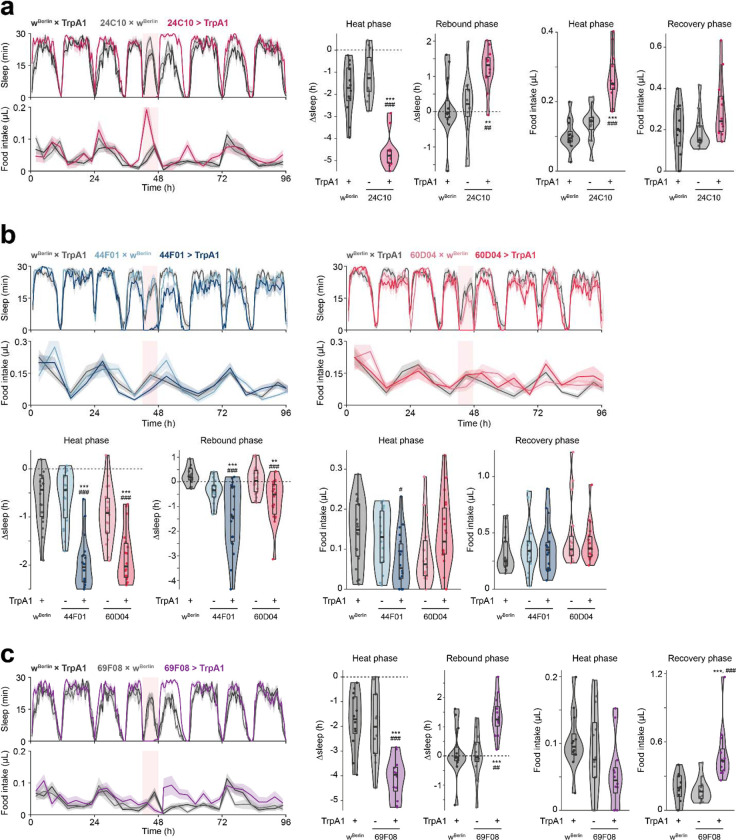
Figure 3. Thermogenetic stimulation of various subsets of cholinergic neurons causes soft or hard sleep loss.
(a) 24C10-neuron stimulation elicits sleep loss and increased feeding during stimulation, as well as increased sleep during recovery phase. N = 12 males per genotype. (b) Stimulation of 44F01 or 60D04 neurons suppresses sleep without post-SD hypersomnia or hyperphagia. N = 6 males per genotype. (c) Stimulation of R2 neurons using 69F08-GAL4 driver suppresses sleep and food intake during the stimulation, with increased post-SD sleep rebound and food intake. N = 12 males per genotype. Box plots represent median and interquartile range. All lines represent mean and the shaded regions SEM. Following one-way ANOVA, significant differences were compared post-hoc using Games-Howell (if variance not homogeneous by Levene’s test) or Tukey pairwise comparisons (if variance homogeneous) between the experimental and each of the control lines. Significant differences from the post-hoc comparisons are noted as: #, significantly different from TrpA1 control; *, significantly different from GAL4 control. The number of symbols denote the p value of the difference between the control and the sleep-deprived group (*/#, p < 0.05; **/##, p < 0.01; ***/###, p < 0.001).

