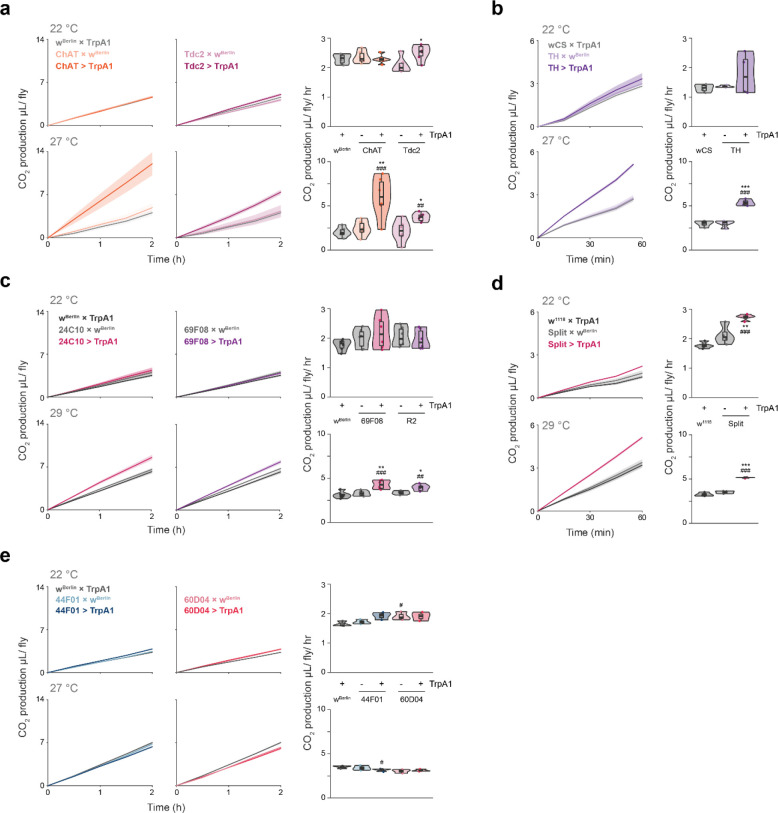
Figure 4. Increased respiratory metabolism is associated with manipulations that induce hard sleep loss.
(a-e) 2-hour time-course (in 30-minute bins) or average CO2 production during stimulation of the noted neurons at the indicated temperatures. N = 6 cohorts per genotype, 4 males per cohort. Box plots represent median and interquartile range. Lines represent mean and the shaded regions SEM. Following one-way ANOVA, significant differences were checked for homogeneity of variance using Levene’s test and post-hoc comparisons between the experimental and each of the control lines were performed using Tukey’s multiple comparisons test. Significant differences from the post-hoc comparisons are noted as: #, significantly different from TrpA1 control; *, significantly different from GAL4 control. The number of symbols denote the p value of the difference between the control and the sleep-deprived group (*/#, p < 0.05; **/##, p < 0.01; ***/###, p < 0.001).

