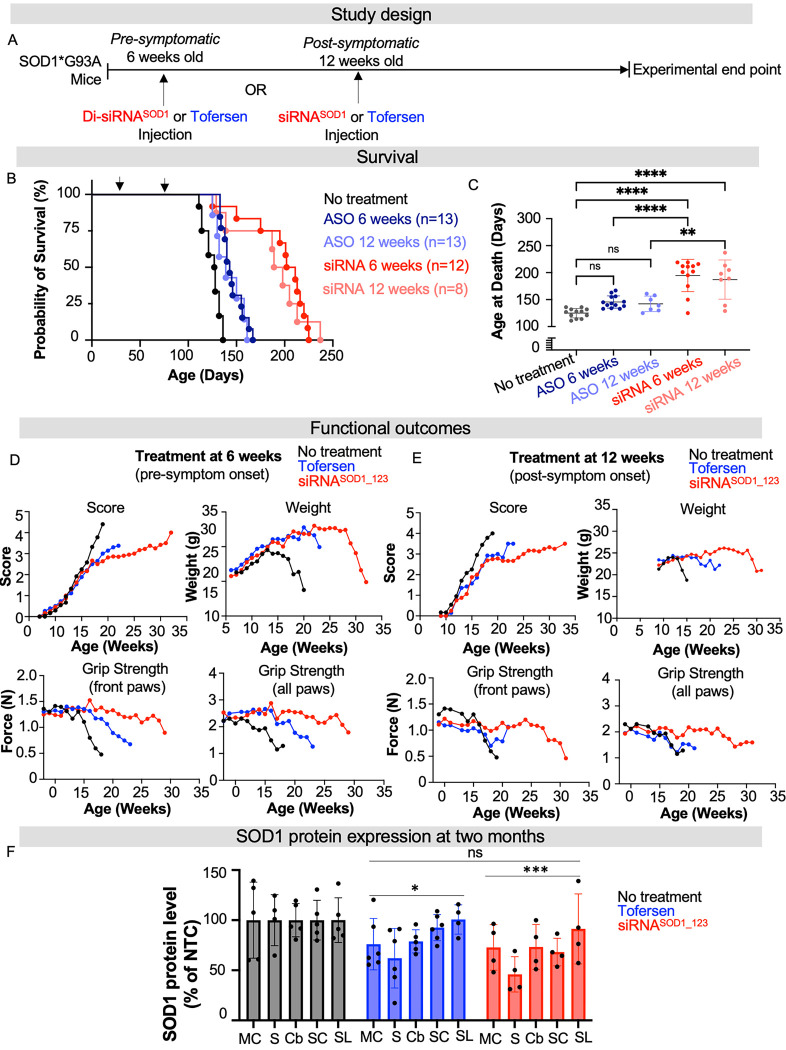
Fig. 3. Di-siRNASOD_123 showed enhanced survival compared to tofersen-treated G93A mice.
(A) Study design. Treatment with tofersen (ASO, blue) or di-siRNASOD1_123 (siRNA, red) was initiated pre- (6-weeks) or post- (12-weeks) symptom onset. (B) Kaplan-Meier survival curve of naïve (black), non-targeting control (NTC, gray), ASO-6 weeks (dark blue), ASO-12 weeks (light blue), siRNA-6 weeks (red) or siRNA-12 weeks (light red) G93A mice. (C) Plotted age at death (in days) for all groups. (D) Impact of NTC (black), ASO (blue) or siRNA (red) treatment at 6 weeks on ALS score, weight, and grip strength when delivered. (E) Impact of NTC (black), ASO (blue) or siRNA (red) treatment at 12 weeks on ALS score, weight, and grip strength. (F) SOD1 protein at two months post-injection across CNS regions in NTC (gray), tofersen (blue) treated, or di-siRNASOD1_123 (red) treated mice. MC-medial cortex, S-striatum, T-thalamus, H-hippocampus, C-cortex, BS-brainstem, Cv-cervical spinal cord, Tc-thoracic spinal cord, L-lumbar spinal cord. * p < 0.05, ** p< 0.01, *** p < 0.001, **** p < 0.0001, Two-way ANOVA with multiple comparisons.

