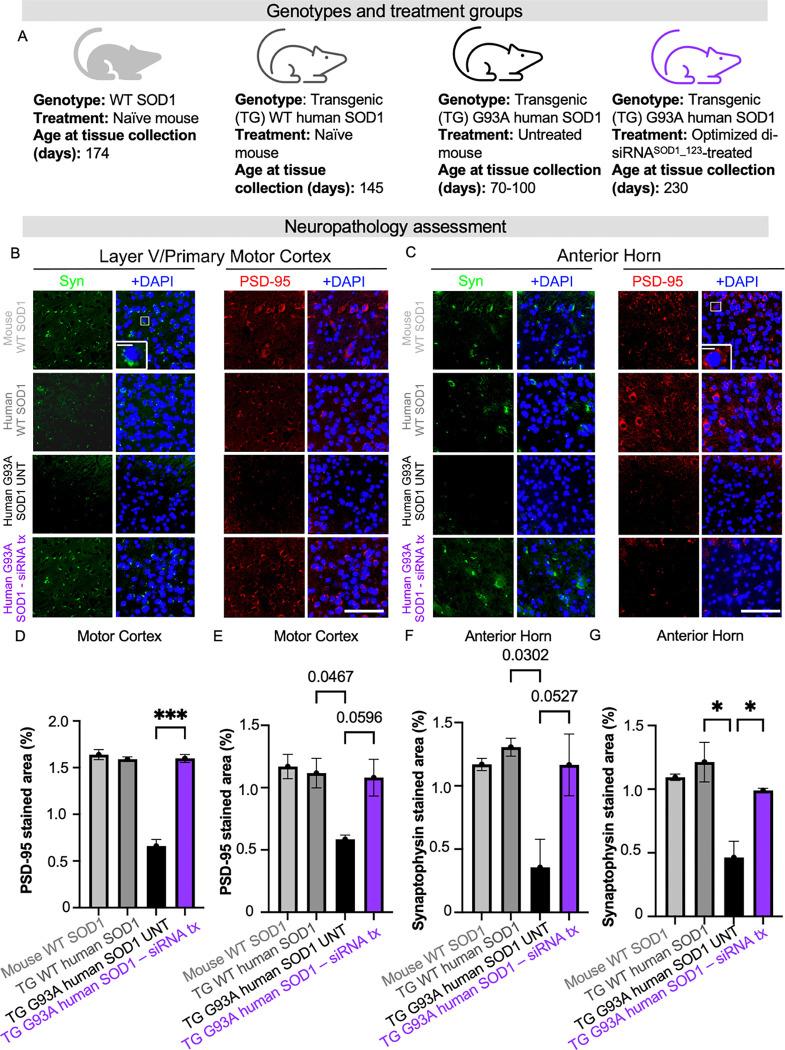
Figure 7: SOD1 silencing with di-siRNA rescued loss of synaptic markers in G93A mice.
(A) Genotypes and treatment groups used to assess neuropathology. (B) Representative images and insets showing presynaptic marker synaptophysin and postsynaptic marker PSD-95 staining signal from layer V of primary motor cortex. (C) Representative images and insets showing synaptophysin and PSD-95 staining signal from anterior horn of the lumbar spinal cord. (D) Quantification of PSD-95 in layer V of primary motor cortex. (E) Quantification of PSD-95 in anterior horn. (F) Quantification of synaptophysin in layer V of primary motor cortex (G) Quantification of synaptophysin in the anterior horn. Scale bar=100 μm, Scale bar=10 μm (inset). Data in the bar graphs are shown as mean ±SEM n=2 per group.

