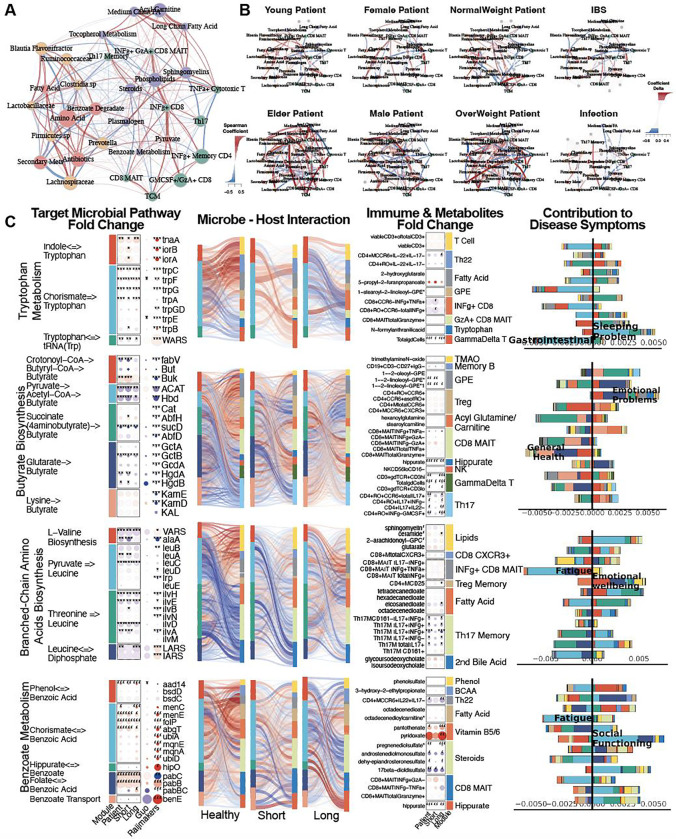
Figure 4: Microbiome-Immune-Metabolome Crosstalk is Dysbiotic in ME/CFS.
A-B) Microbiome-Immune-Metabolome Network in A) Healthy and B) Patient Subgroups. A baseline network was established with 200+ healthy control samples (A), bifurcating into two segments: the gut microbiome (species in yellow, genetic modules in orange) and blood elements (immune modules in green, metabolome modules in purple). Nodes: modules; size: # of members; colors: ‘omics type; edges: interactions between modules, with Spearman coefficient (adjusted) represented by thickness, transparency, and color - positive (red) and negative (blue). Here, key microbial pathways (pyruvate, amino acid, and benzoate) interact with immune and metabolome modules in healthy individuals. Specifically, these correlations were disrupted in patient subgroups (B), as a function of gender, age (young <26 years old vs. older >50), BMI (normal <26 vs. overweight >26), and health status (individuals with IBS or infections). Correlations significantly shifted from healthy counterparts (Supplemental Figure 6C) are highlighted with colored nodes and edges indicating increased (red) or decreased (blue) interactions. C) Targeted Microbial Pathways and Host Interactions. Four important microbial metabolic mechanisms (tryptophan, butyrate, BCAA, benzoate) were further analyzed to compare control, short and long-term ME/CFS patients, and external cohorts for validation (Guo28 and Raijmakers29).1. Microbial Pathway Fold Change: Key genes were grouped and annotated in subpathways. Circle size: fold change over control; color: increase (red) or decrease (blue), p-values (adjusted Wilcoxon) marked. 2. Microbiome-Host Interactions: Sankey diagrams visualize interactions between microbial pathways and host immune cells/metabolites. Line thickness and transparency: Spearman coefficient (adjusted); color: red (positive), blue (negative). 3. Immune & Metabolites Fold Change: Pathway-correlated immune cells and metabolites are grouped by category. 4. Contribution to Disease Symptoms: Stacked bar plots show accumulated SHAP values (contributions to symptom severity) for each disease symptom (1–12, as in Supplemental Table 1). Colors: microbial subpathways and immune/metabolome categories match module color in fold change maps. X-axis: accumulated SHAP values (contributions) from negative to positive, with the most contributed symptoms highlighted. P-values: *p < 0.05, **p < 0.01, ***p < 0.001. Abbreviations: IBS, Irritable Bowel Syndrome; BMI, Body Mass Index; BCAA, Branched-Chain Amino Acids; MAIT, Mucosal-Associated Invariant T cell; SHAP, SHapley Additive exPlanations; GPE, Glycerophosphoethanolamine; INFγ, Interferon Gamma; CD, Cluster of Differentiation; Th, T helper cell; TMAO, Trimethylamine N-oxide; KEGG, Kyoto Encyclopedia of Genes and Genomes. Supporting Materials: Supplemental Table 7–8, Supplemental Figure 6.

