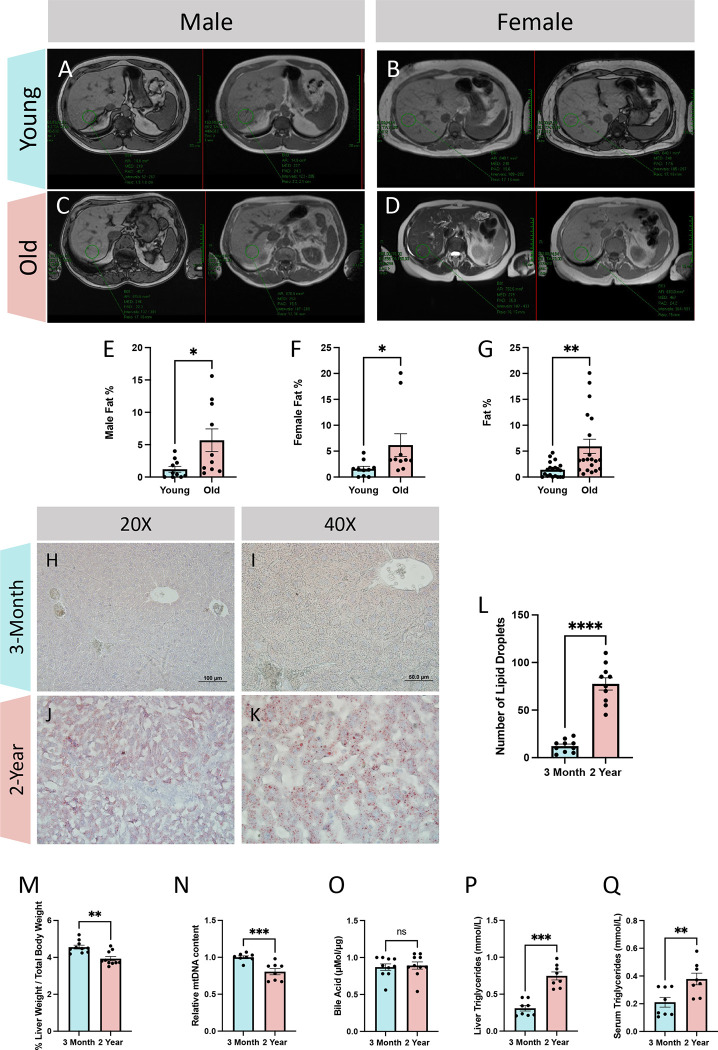
Figure 1: Comparative analyses of liver lipid content and morphology in young and old patients.
Cross-sectional imaging of in-phase (left) and out-of-phase (right) liver anatomy data from (A) males under 55 years old (aged 14–53 years old; n = 10), (B) females under 55 years old (aged 17–41 years old; n = 10), (C) males over 60 years old (aged 60–85 years old; n = 10), and (D) females over 60 years old (aged 64–96 years old; n = 10). (E) Computed fat percentage in males, (F) females, and (G) combined young and old cohorts. (H) Oil Red O staining at 20X and (I) 40X magnification in young and (J-K) old samples. (L) Quantification of Oil Red O staining per area in 3-month and 2-year murine liver samples (n=10). (M) Quantifications of liver weight relative to total body weight as a percent (n=10), (N) relative reverse transcription-quantitative polymerase chain reaction mtDNA content (n=8), (O) bile acids concentrations (n=10), (P) liver triglycerides concentration (n=8), (Q) and serum triglycerides concentration (n=8). For all panels, error bars indicate SEM, Mann–Whitney tests were used for statistical analysis, and significance value indicate *P ≤ 0.05, **P ≤ 0.01, ***P ≤ 0.001, ****P ≤ 0.0001, and ns indicates non-significant.

