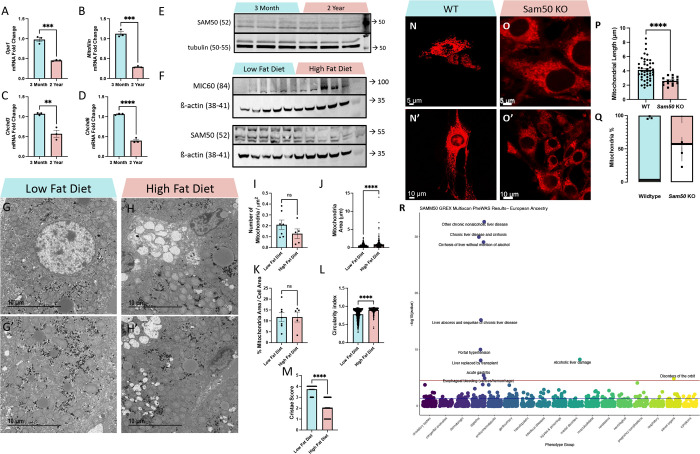
Figure 5. Aging Causes MICOS Loss, Diet Changes Affect SAM50 Expression, and SAM50 has Genetic Associations with Liver Diseases.
(A-D) Quantitative PCR shows changes in mRNA transcripts in (A) Opa1, (B) Mitofilin/Mic60, (C) Chchd3/Mic19, and (D) Chchd6/Mic25 between 3-month and 2-year murine liver samples. (E) Western blotting showing SAM50 protein levels, relative to tubulin, in 3-month and 2-year murine liver samples. (F) Western blotting showing MIC60 and SAM50 protein levels, relative to ß-actin, in low-fat diet and high-fat diet murine liver samples. (G-G’) Representative transmission electron micrographs from low-fat diet and (H-H’) high-fat diet murine liver tissue. Quantifications of (I) mitochondria number, as normalized to cell area (n=7, low fat diet; n=5, high fat diet), (J) individual mitochondrial area (n=592, low fat diet; n=266, high fat diet), (K) the sum of all mitochondrial area normalized to total cell area (n=7, low fat diet; n=5, high fat diet), (L) mitochondrial circularity index, (n=598, low fat diet; n=271, high fat diet), and (M) cristae score (n=425, low fat diet; n=425, high fat diet). (N-N’) Representative confocal fluorescence (using mCherry-Mito-7) from wildtype and (O-O’) Sam50-knockout fibroblasts. (P) Quantifications of mitochondrial length. (Q) Relative proportion of mitochondria that are either fragmented or tubular in wildtype and Sam50 KO fibroblasts, with the white area representing percentage of fragmentation and colored areas representing percentage of typical tubular. (R) Phenome-wide association study (PheWAS) results for SAMM50 GReX in individuals of European ancestry (n=70,440). The GReX for SAMM50 was tested for association across 1,704 clinical phenotypes extracted from the EHR. Association tests were run using logistic regression models, accounting for genetic ancestry (principle components/PC 1–10), sex, age, median age of medical record, and genotyping batch. Associations that met the Bonferroni-corrected threshold (red line, p < 2.934272 × 10⁻⁵) are labeled with phenotype name [see SFile 1 for all PheWAS results]. The blue line represents nominal significance (p = 0.05) For all panels, error bars indicate SEM, Mann–Whitney tests were used for statistical analysis, and significance value indicate ****P ≤ 0.0001, ns indicates non-significant.

