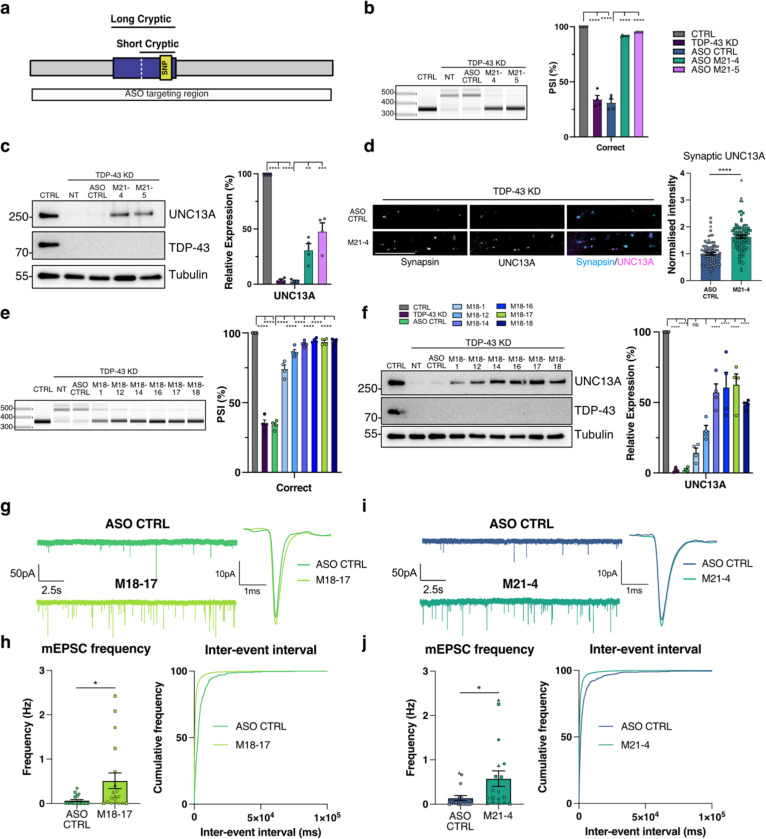
Fig. 4 |. ASO mediated correction of UNC13A CE rescues synaptic function following TDP-43 knockdown.
a, Schematic of UNC13A cryptic exon. b, RT-PCR analysis of UNC13A splicing in HaloTDP iNeurons shows 21nt ASOs prevent cryptic splicing after TDP-43 knockdown with quantification of results n=4 biological replicates from 2 experiments. c, Western blot analysis shows rescue of UNC13A protein following 21nt ASO treatment after TDP-43 KD with quantification. n=4 biological replicates from 2 experiments. d, Quantification of UNC13A intensity at synapsin positive synaptic terminals in TDP-43 knockdown iNeurons treated with MOE CTRL ASO (n=88) and M21–4 ASO (n=96). Scale bar = 10 μm. e, RT-PCR analysis of UNC13A splicing in HaloTDP iNeurons shows 18 nt ASOs prevent cryptic splicing after TDP-43 knockdown with quantification of results n=4 biological replicates from 2 experiments. f, Western blot analysis shows rescue of UNC13A protein following 18 nt ASO treatment after TDP-43 KD with quantification. n=4 biological replicates from 2 experiments. g, Representative mEPSCs traces and average mEPSCs traces from TDP-43 KD iNeurons treated with MOE CTRL ASO (n=17) and M21–4 ASO (n=18). h, Quantification of mEPSC frequency and inter-event interval cumulative distributions. i, Representative mEPSCs traces and average mEPSCs traces from TDP-43 KD iNeurons treated with CTRL ASO (n=19) and M18–17 ASO (n=19). j, Quantification of mEPSC frequency and inter-event interval cumulative distributions. Graphs for (b) (c) (d) (e) (f) (h) and (j) represent mean ± s.e.m. Statistics for (b) (c) (e) and (f) are One-way ANOVA with Tukey multiple comparison test. Statistics for (d) (h) and (j) are two-sided Student’s t test. *P < 0.05; ** P <0.01; *** P <0.001; **** P < 0.0001; ns (not significant).

