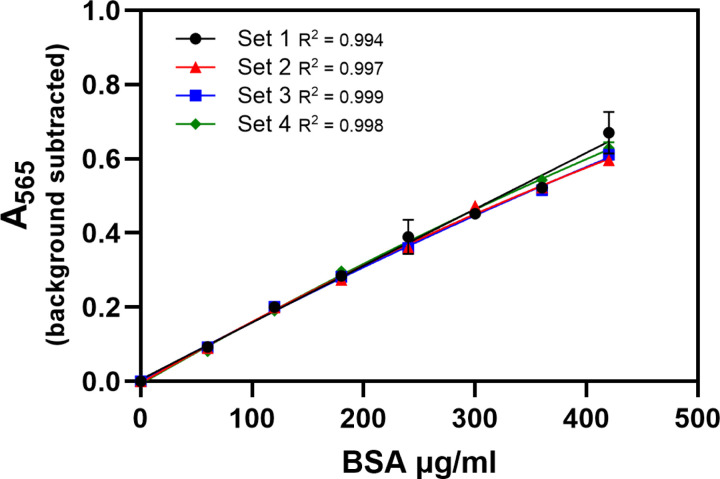
Figure 5.
Four sets of diluted standards were prepared by one investigator and assayed on the same plate to assess intra-person variability when plating and developer were controlled. When developer variability was controlled in this way, the curves for each set of standards prepared by one investigator were aligned for protein concentrations ≤240µg/ml. Data is mean ± SEM.

