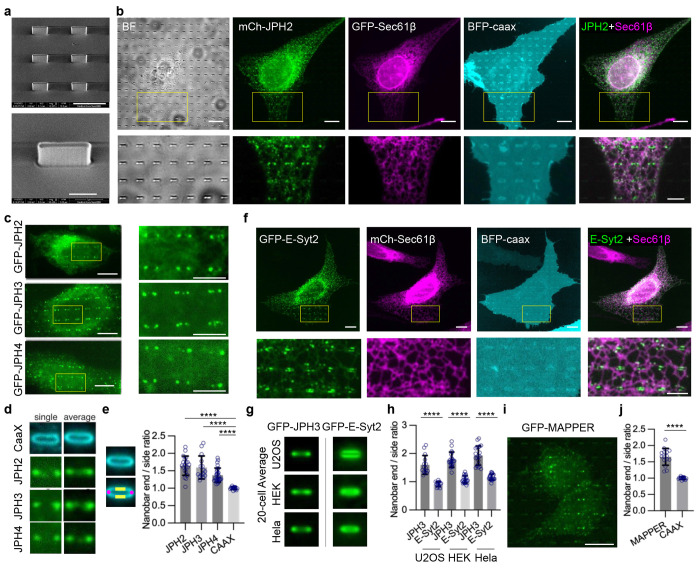
Fig. 3: JPH family of tethering proteins, but not E-Syt2, exhibit a strong preference for PM curvatures.
a, SEM images of nanobars. Scale bar 4 μm on the top, 1 μm at the bottom. b, U2OS cells co-expressing mCherry(mCh)-JPH2 (green), GFP-Sec61β (magenta), and BFP-CAAX (Cyan). mCh-JPH2 preferentially accumulates at the ends of nanobars. Bottom: Enlarged images of the regions in yellow boxes. Right: merged image of JPH2 and Sec61β. Scale bar 10 μm on the top, 5 μm at the bottom. c, Representative images show that GFP-JPH2, GFP-JPH3 or GFP-JPH4 preferentially accumulates at the end of nanobars. Right: Enlarged image of the yellow boxed 6 nanobars. Scale bar 10 μm on the left, 5 μm on the right. d, Enlarged single nanobar images and the average nanobar images of cells shown in c. Left: image of a single nanobar; right: the averaged image of all nanobars within a single cell. e, Quantification of the nanobar end-to-side ratios. The ratios are calculated using the average intensity of the bar ends (the magenta mask) divided by the average intensity of the bar sides (the yellow mask). Each dot in the quantification graph represents the average value of a single cell. n = 20, 15, 27, 15 cells for JPH2, JPH3, JPH4 and CAAX. ****P < 0.0001. f, U2OS cells co-expressing GFP-E-Syt2 (green), mCherry-Sec61β (magenta), and BFP-CAAX (Cyan). GFP-E-Syt2 does not preferentially accumulate at the ends of nanobars. Bottom: Enlarged images of the regions in yellow boxes. Right: merged image of GFP-E-Syt2 and mCherry-Sec61β. Scale bar 10 μm on the top, 5 μm at the bottom. g, Average nanobar images of GFP-JPH3 and GFP-E-Syt2 singly expressed in U2OS, HEK, and Hela cells respectively. n = 20 cells for each indicated probe in each cell line. h, Quantifications of the end-to-side intensity ratios for GFP-JPH3 or GFP-E-Syt2 in U2OS cell, HEK-293T cells, or Hela cells. n = 20 cells for each condition. ****P < 0.0001. i, U2OS cells expressing GFP-MAPPER on nanobars. Scale bar 10 μm. j, Quantifications of the nanobar end-to-side ratios for GFP-MAPPER and GFP-CAAX. n = 15 cells for each probe. ****P < 0.0001. All experiments were independently replicated at least three times. All error bars represent STD. Brown-Forsythe and Welch ANOVA tests was used to assess significance for (e,h). Two-tailed Welch’s t test was used to assess significance for (j).

