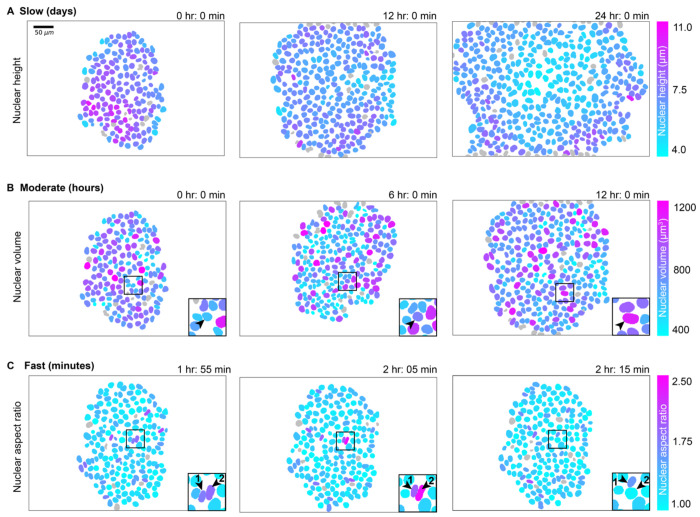
Figure 2. Aspects of nuclear shape vary on three timescales, each driven by a distinct source of variation.
Maximum projections of 3D nuclear segmentations color-mapped to features of nuclear shape, created with the Timelapse Feature Explorer (Methods). The associated timelapses for these snapshots were also exported from the Timelapse Feature Explorer and are provided as Movies S7, S8 and S9. Due to the nature of viewing 3D segmentations as 2D maximum projections, the apparent nuclear size and shape in these images can be misleading; the color-mapping of these images is the best way to interpret their quantitative size and shape features. The colormap limits are chosen to highlight the variation of each feature across the population. A. Maximum projections of 3D nuclear segmentations colored by height at times t=0 hours, 12 hours and 24 hours. B. Maximum projections of 3D nuclear segmentations colored by volume at times t=0 hours, 6 hours, and 12 hours. Inset highlights an individual nucleus as its volume increases over its cell cycle. C. Maximum projections of 3D nuclear segmentations colored by aspect ratio (the length of the longest axis divided by the orthogonal in-plane axis) at times t=1 hour 55 minutes, 2 hours 5 minutes, and 2 hours 15 minutes. Inset highlights two neighboring nuclei that change aspect ratio on the timescale of minutes as they “squeeze” past each other. The same colormap is applied for each row of three images and its range is indicated on the right.

