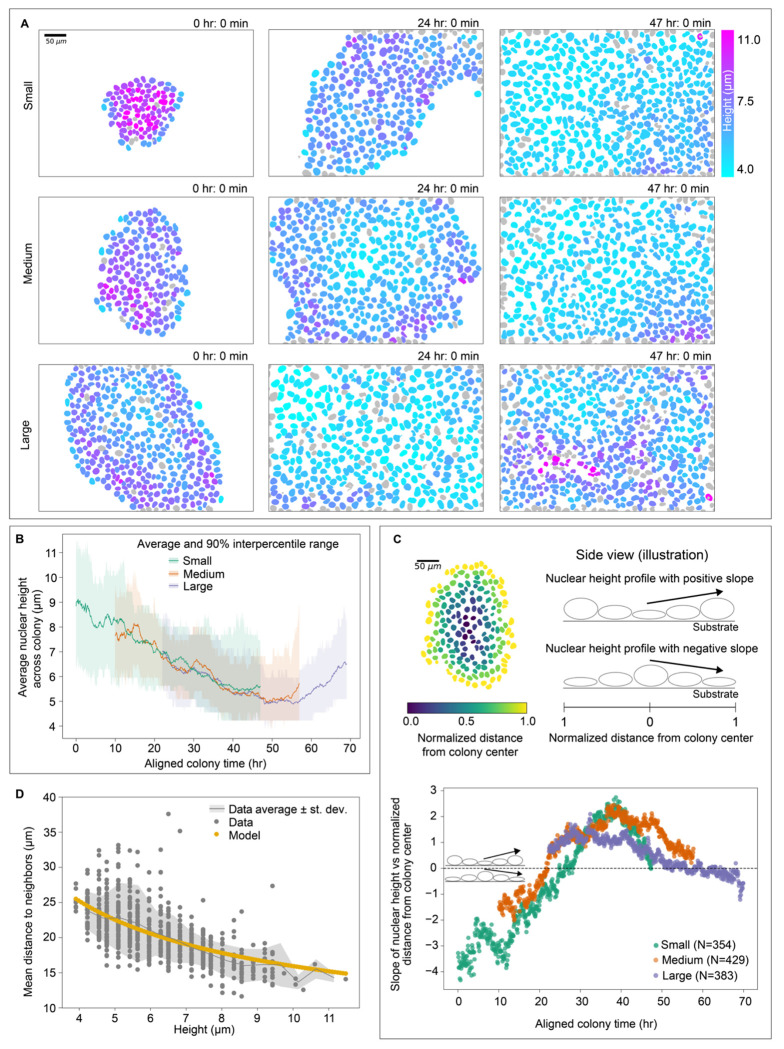
Figure 3. Nuclei exhibit changing spatiotemporal patterns in height as colonies grow.
A. Maximum projections of 3D nuclear segmentations colored by height for the Small, Medium, and Large colonies at 0 hours, 24 hours, and 47 hours, created with the Timelapse Feature Explorer (Methods). The associated timelapses for these snapshots were also exported from the Timelapse Feature Explorer and are provided as Movies S7, S10 and S11. The same color map is applied to all nine images. B. The average nuclear height trajectory for the Small, Medium and Large colonies. The height trajectories for each colony have been aligned along the time axis to maximize the overlap between them (Methods). This represents the “aligned colony time” used in other analyses. The shaded region is the 5th to the 95th percentile (“90% interpercentile range”) for nuclear height. C. Top, Left: Maximum projection of the segmented image of the Medium colony at t=0, colored by the normalized distance from the colony center (Methods). Top, Right: A cartoon illustration of the side view of the colony with two example height profiles where the slope is measured radially from the colony center. The slope is positive when the nuclei at the center of the colony are shorter than the nuclei closer to the edge or image field of view (“FOV,” Methods). Bottom: The slope of the best linear fit line for the height vs. normalized distance from the colony center for all colony timepoints, for all three colonies (see Supplemental Fig. S3A for examples). The inset shows the cartoon of the side view of the colony to illustrate different regimes above and below the zero-slope reference line in the height profile. D. The relationship between the mean distance between neighbor centroids and the nuclear height is shown for nuclei with volumes of 630 μm3 (gray; Methods). Modeling the cells as hexagonal cylinders (yellow) allows them to pack closely in alignment with known data.

