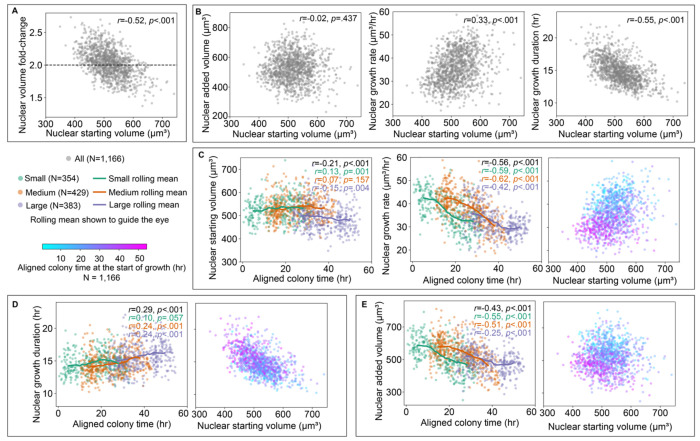
Figure 6. Nuclear added volume is an outcome of colony context-dependent nuclear growth rates and colony context-independent nuclear growth durations.
All correlations reported in this figure are Pearson’s correlation coefficients (r) with p-values (p) for all nuclei in the full-interphase analysis dataset, reported in black for all nuclei pooled across all three colonies and in green, orange, or purple for each colony separately. The N for each population is indicated in the legend along with the color map for aligned colony time. A. Relationship between the nuclear volume fold-change and the nuclear starting volume for all full-interphase nuclear trajectories. Dashed reference line at nuclear volume fold-change of 2 (doubling from the start of growth). B. The relationships of nuclear added volume, growth rate, and growth duration with nuclear starting volume for all full-interphase nuclear trajectories. C. Left, Middle: Nuclear starting volume and nuclear growth rate over aligned colony time at the start of growth for the Small, Medium, and Large colonies, with rolling mean shown to guide the eye. Right: Relationship between nuclear growth rate and nuclear starting volume for all full-interphase nuclear trajectories (shown in B) colored by aligned colony time at the start of growth. D-E, Left: Nuclear growth duration and nuclear added volume over aligned colony time at the start of growth, with rolling mean shown for the Small, Medium, and Large colonies. D-E, Right: Relationships between the nuclear growth duration and nuclear added volume for all full-interphase nuclear trajectories (shown in A, B) colored by aligned colony time at the start of growth.

