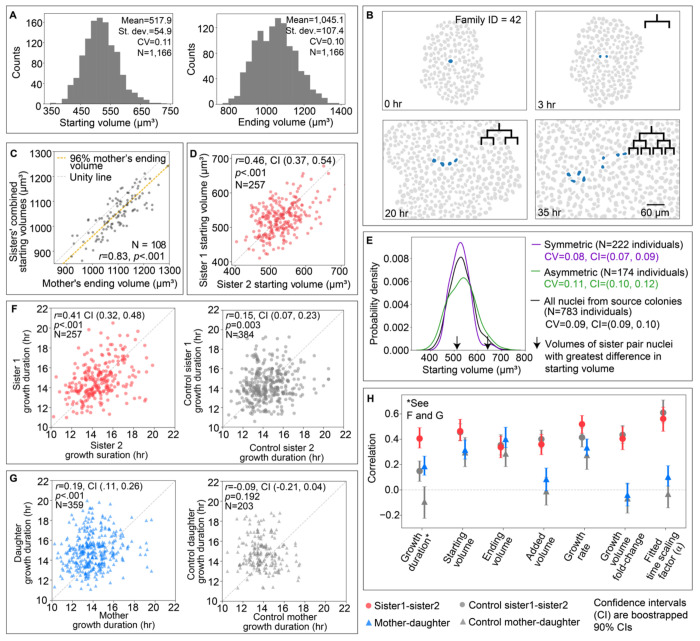
Figure 7. Nuclear starting volume and growth duration are inherited from one generation to the next, while other nuclear growth features depend on their colony context.
All correlations reported in this figure are Pearson’s correlation coefficients (r) with p-values (p). All confidence intervals (reported numerically or shown as error bars) are bootstrapped 90% interpercentile confidence intervals (see Methods for details). A. Distribution of nuclear starting volumes and ending volumes with the mean, standard deviation, and coefficient of variation (CV) for all nuclei in the full-interphase analysis dataset. B. Maximum projection of nuclear segmentations for the Medium colony colored by an example lineage tree at the start of each new generation (0, 3, 20, and 35 hour timepoints). In this representative lineage tree, two generations are captured for their entire interphase (3-20 hrs and 30-35 hrs). C. The relationship between the sisters’ combined starting volumes and their mother’s ending volume. Dashed reference lines are shown for the unity line (black) and for 96% of the mother’s ending volume, the average percent of the mother’s nuclear ending volume reached by the sisters’ combined nuclear starting volume (red; Supplemental Fig. S11A). D. The relationship between the starting volumes for sister pairs. The unity line is shown for reference. E. The probability density of the starting volume for symmetric sisters, asymmetric sisters, and all nuclei from the lineage-annotated analysis dataset with the CV for each (Methods). Arrows denote the starting volumes for the most asymmetric sister pair as a reference for the maximum distance sister pairs would span in the starting volume distribution. F. Left: The relationship of growth durations for all sister pairs in the lineage-annotated analysis dataset. Right: The relationship of growth durations for mother-daughter pairs. G. Left: The relationship between two control sister pairs which are unrelated nuclei born within 10 minutes, a 60 μm radius, and a difference in starting volume less than 80 μm3 (Methods, Supplemental Fig. S12B). Right: The relationship between control mother-daughter pairs which are unrelated nuclei where the control mother’s breakdown is within 60 minutes and a 60 μm radius of the control daughter. Their size is constrained such that the control daughter’s starting volume is within 60 μm3 of half the control mother’s ending volume (Methods). H. The growth duration correlation (r) between sister pairs, mother-daughter pairs and their respective control pairs from the scatter plots in panel G are plotted in H, with error bars indicating the bootstrapped 90% confidence intervals on these correlations. Correlation values with confidence intervals between sister pairs, mother-daughter pairs and their respective controls are also shown for nuclear starting volume, ending volume, growth rate, volume fold-change, and fitted time scaling factor (α) (See Supplemental Fig. S12C for the equivalent scatter plots as in F and G).

