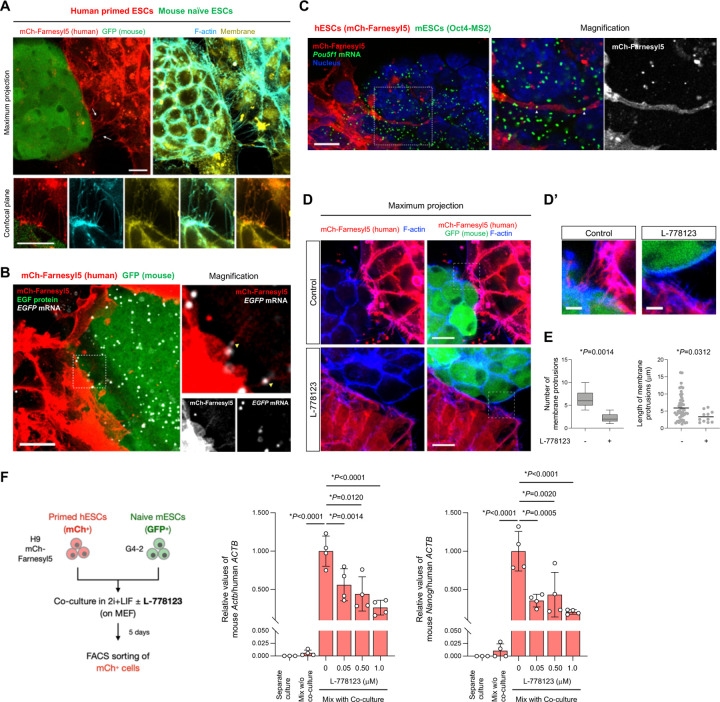
Fig. 3. mRNA-containing membrane protrusions from mouse to human cells are required for mRNA transfer.
(A) Co-culture of H9 mCherry-Farnesyl5 (red) hESCs and G4-2 GFP (green)-expressing mESCs stained with F-actin (cyan) and membrane (yellow) specific dyes. Top images are maximum projection of z-stacked images. Bottom images are from a confocal plane of a magnified region containing membrane protrusions. Arrows indicate membrane protrusions connecting hESCs and mESCs. (scale bar, 10 mm)
(B) Representative confocal images of EGFP RNA (white) in the coculture of H9 mCherry-Farnesyl5 (red) hESCs and G4-2 GFP (green)- expressing mESCs visualized by RNAscope (scale bar, 10 mm). The area indicated by the dashed box is also magnified in the right panels.
(C) Representative confocal images of MS2-tagged Pou5f1 RNA (green) in the coculture of H9 mCherry-Farnesyl5 (red) hESCs and Oct4-MS2 mESCs visualized by RNAscope (scale bar, 10 mm). The area indicated by the dashed box is also magnified in the right panels.
(D-D’) Maximum projection images of the co-culture of H9 mCherry-Farnesyl5 (red) hESCs and G4-2 GFP (green)-expressing mESCs treated either with control or with L-778123 (0.5 mM). The cells were counterstained with F-actin-specific dye (blue) (D, scale bar, 10 mm). The area indicated by the dashed box is also magnified in D’ as a confocal plane (scale bar, 5 mm).
(E) Quantification of the number (left) and the length (right) of membrane connections observed between hESCs and mESCs in the presence or absence of L-778123.
(F) Experimental design for primed H9 hESCs (mCherry-positive) and naïve G4-2 mESCs (GFP-positive) co-culture in the presence of L-778123 followed by FACS sorting of mCherry-positive fraction (left, also see Fig. S5B). RT-qPCR analyses of mouse Actb and Nanog RNAs in the sorted hESCs from mix with co-culture conditions treated with the indicated concentrations of L-778123. The separate culture as well as mix w/o co-culture was set as control. Relative values normalized with endogenous human ACTB expression are shown.

