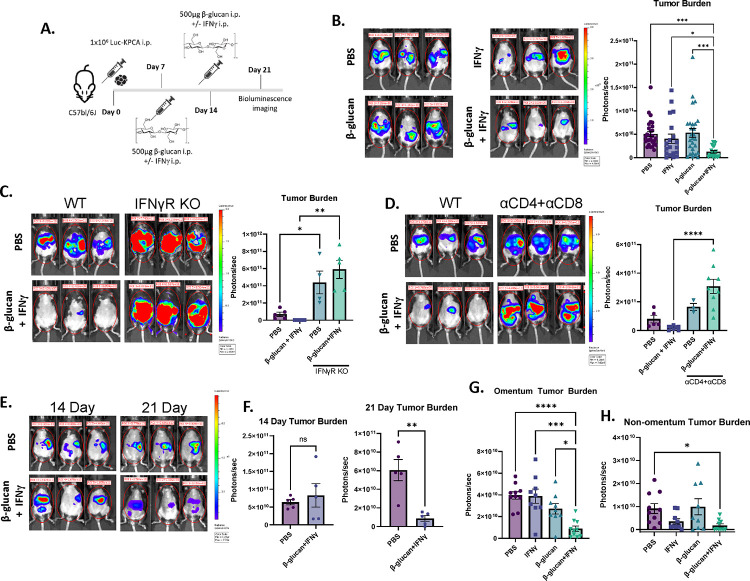
Figure 3. Combining β-glucan with IFNγ reduces KPCA tumor burden through host immunity.
(A) β-glucan+IFNγ (BI) treatment timeline in the KPCA OvCa model. (B) Representative bioluminescence images and quantification of bioluminescence signals in mice treated with PBS, IFNγ, β-glucan, or BI. Representative bioluminescence images and quantification of bioluminescence signals in (C) IFNγ Receptor knockout mice and (D) T cell-depleted mice treated with PBS or BI. (E) Representative bioluminescence images and (F) quantification of bioluminescence signals of PBS and BI treated mice 14- and 21-days post tumor seeding. Quantification of (G) Omentum and (H) non-omentum body cavity bioluminescence signals in PBS-, IFNγ−, β-glucan-, or BI-treated mice. One-way ANOVA and student’s t test were used. *p<0.05; **p<0.01; ****p<0.0001. Error bars are standard errors of the mean.

