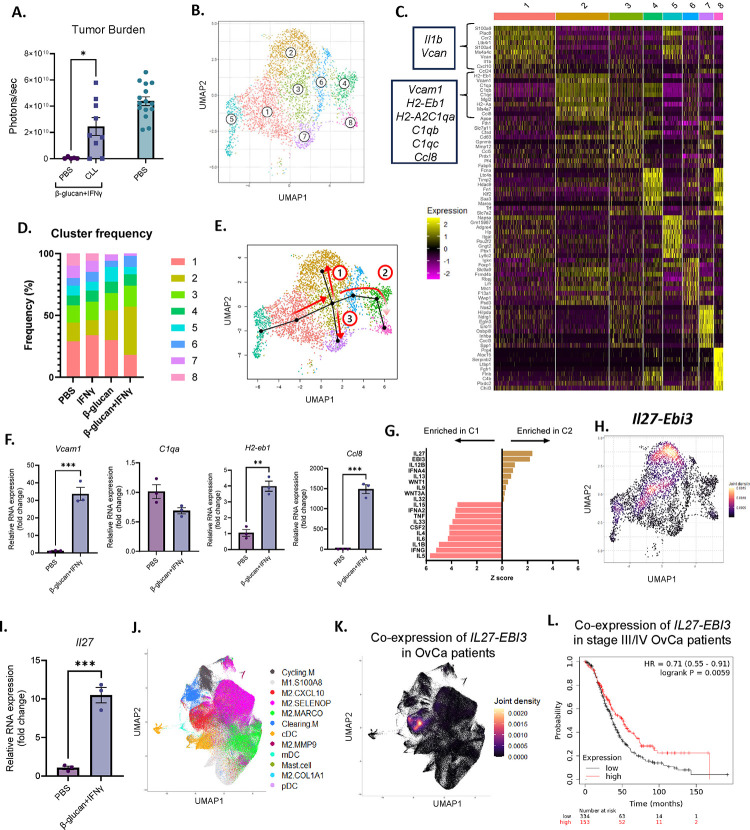
Figure 4. BI enriched IL27+ macrophages in omentum tumors.
(A) Whole body bioluminescence signals of PBS or CLL-treated mice treated with BI and control mice. (B) A UMAP plot of monocyte/MΦ clusters in omentum tumors. (C) Top expressed genes in all monocyte/MΦ clusters. (D) Frequencies of eight identified monocyte/MΦ clusters in omentum tumors. (E) Slingshot trajectory analysis from the origin (Cluster 5) through three independent pathways (red arrows). (F) qPCR analysis of Cluster 2-specific genes in monocyte-derived MΦs treated with PBS or BI. (G) Top upregulated IPA cytokine regulators in Clusters 1 and 2. (H) Il27 and Ebi3 co-expression heatmap in monocyte/MΦ clusters. (I) Il27 expression in monocyte-derived MΦs treated with PBS or BI analyzed by qPCR. (J) UMAP monocyte/MΦ clusters and (K) IL27 and EBI3 co-expression in tumors from human OvCa patients. (L) Overall survival analysis in late stage OvCa patients (stage III and IV) with high and low co-expression of IL27-EBI3. Student’s t test and log rank test were used. *p<0.05; **p<0.01; ****p<0.0001. Error bars are standard errors of the mean.

