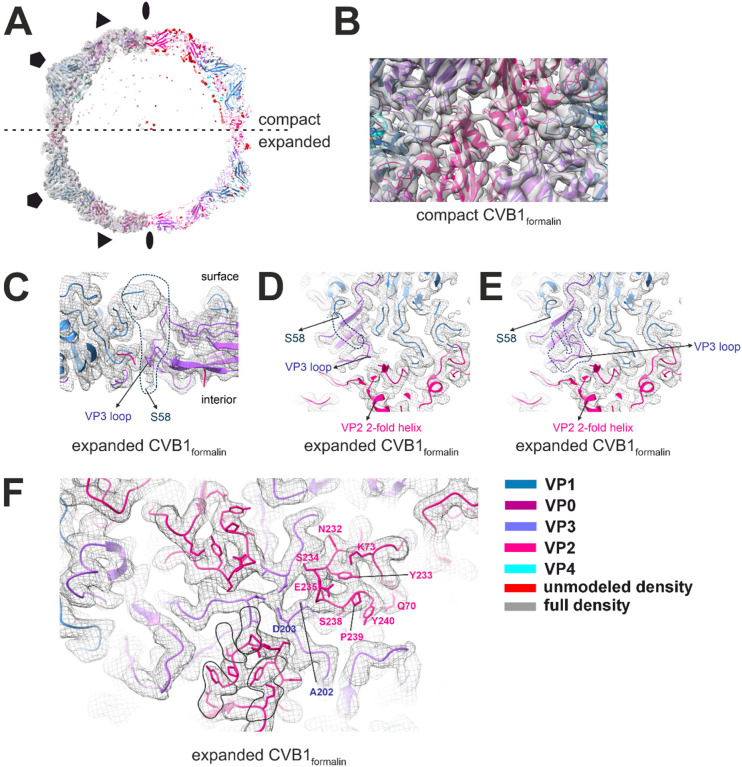
Figure 7.
Final reconstruction analysis of compact and expanded CVB1formalin obtained by cryoEM and single-particle reconstruction. A. Final reconstructions shown as surface at 2.5 (compact) or 5.5 (expanded) σ above mean with fitted model (left) and the atomic model with unmodeled density in red (right). Symmetry axes are marked with elipse (2-fold), triangle (3-fold) and pentagon (5-fold). Colour legend is in the bottom right corner of the figure. B. Focused view along the 2-fold axis of compact CVB1formalin shown as model fitted into density map represented as surface at 2.5σ above mean. C-F. Focused view on the expanded CVB1formalin shown as model fitted into density map represented as mesh at 5.5σ above mean. C. View through a slice of the capsid showing the beginning of VP1 N-terminus (S58) and VP3 loop at the quasi-3-fold pore. Density for possible VP1 N-terminus is marked with a dotted line and is clashing with VP3 loop. D and E. View of the quasi-3-fold pore with potential alternative densities which could be modelled marked with a dotted line for VP1 N-terminus (D) or VP3 loop (E). F. View on the surface of the capsid at the 3-fold symmetry axis. Density for ion is visible at the center of the 3-fold coordinated by 3 Asp. Cross-linking due to formalin treatment is circled in black on one asymmetric subunit. Residues of interest are marked on another asymmetric subunit. Cross-linking occurs both within and across different viral proteins.

