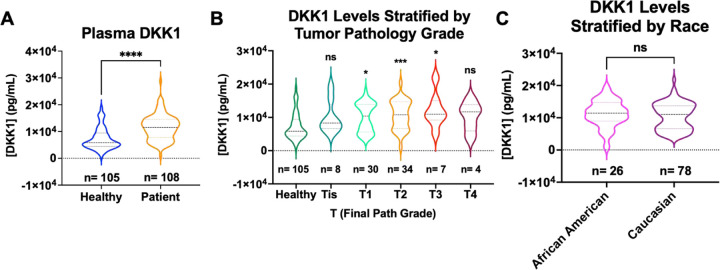
Figure 8:
DKK1 levels are increased in ER+ patients compared to healthy control samples. A) Plasma DKK1 values interpolated by ELISA assay, significance determined by unpaired t-test, ****p < 0.00005. B) DKK1 values stratified by T path grade, significance determined by Kruskal Wallace test, with Dunn’s multiple comparison, *p < 0.05, **p < 0.005, and ***p < 0.0005. C) DKK1 values stratified by self-reported race. Significance determined by Mann Whitney test. DKK1 values are all based on a 1 to 100 dilution in the ELISA assay interpolated to the standard curve.

