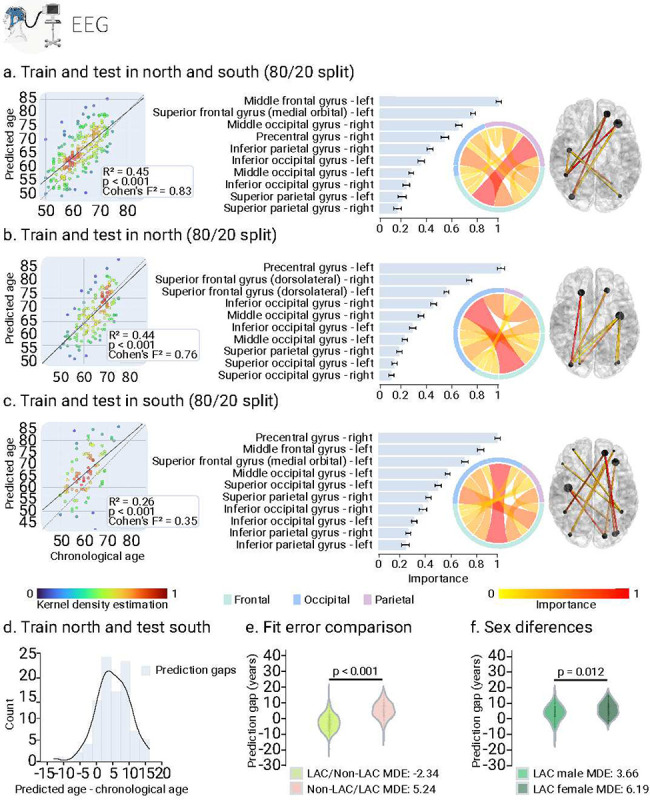
Fig. 3. EEG training and testing the deep learning model in different samples.

(a) Ordinary least squares (OLS) regression comparing chronological age vs. predicted age with the feature importance list for training and testing in the whole sample. (b) Regression comparing chronological age vs. predicted age with the feature importance list for training and testing in the non-LAC dataset. (c) Regression comparing chronological age vs. predicted age with the feature importance list for training and testing in the LAC dataset. For (a), (b) and (c), data point colors indicate the kernel density estimation to provide a visual representation of the density of prediction errors across different values of chronological age. The bars show the brain region feature importance list in descending order, with ring plots and glass brain representations of the most important network-edge connections. (d) Histogram of the prediction error when training in non-LAC dataset and testing in LAC dataset. (e) Violin plot of the distribution and statistical comparison of training and testing with different regions using a permutation test (5000 iterations). (f) Violin plot of the distribution and statistical comparison of testing the models on females and males using a permutation test (5000 iterations). LAC = Latin American countries.
