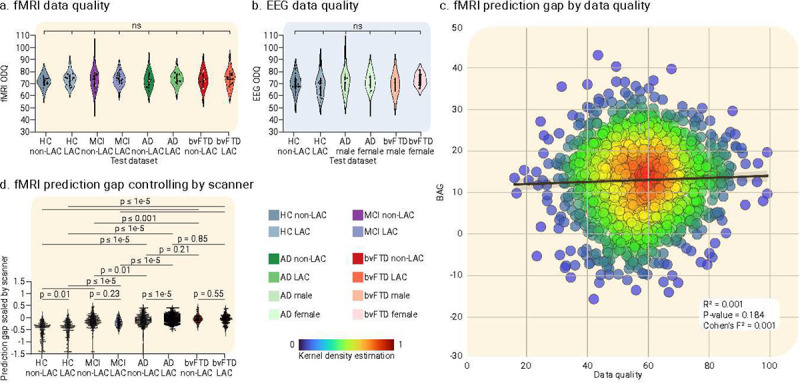
Fig. 5. Sensitivity analysis.

Violin plots for the distribution of data quality metrics of (a) fMRI and (b) EEG datasets. Both panels indicate null results between groups in terms of data quality. (c) Linear regression effects of scanner type, evidencing that the fMRI data quality was not significantly associated with fMRI BAGs differences. (d) fMRI BAG differences across groups controlling for scanner differences. The statistical comparisons were calculated using subsample permutation testing with 5000 iterations. LAC = Latin American countries, HC = Healthy controls, MCI = mild cognitive impairment, AD = Alzheimer’s disease, bvFTD = behavioral variant frontotemporal dementia.
