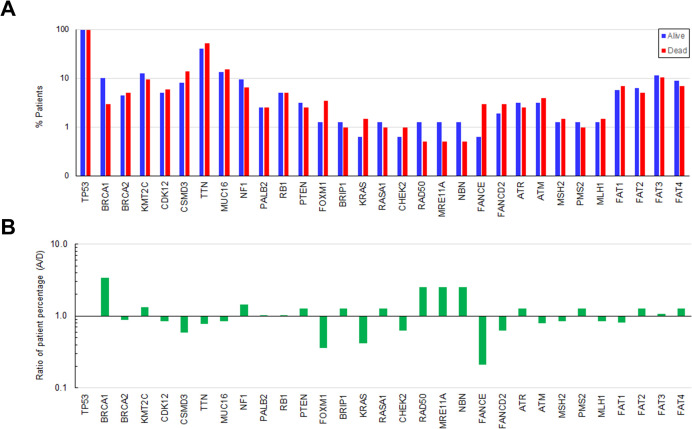
Fig 1. Comparison of gene mutations between alive and deceased EOC patients.
A) The percentages of alive and deceased patients that contained each of 31 gene mutations were determined. 159 patients were alive, and 201 patients were deceased. B) The ratios of the percentages of alive to deceased patients were calculated. The bars indicate a fold change in the percentage of alive patients compared with deceased patients in each gene.

