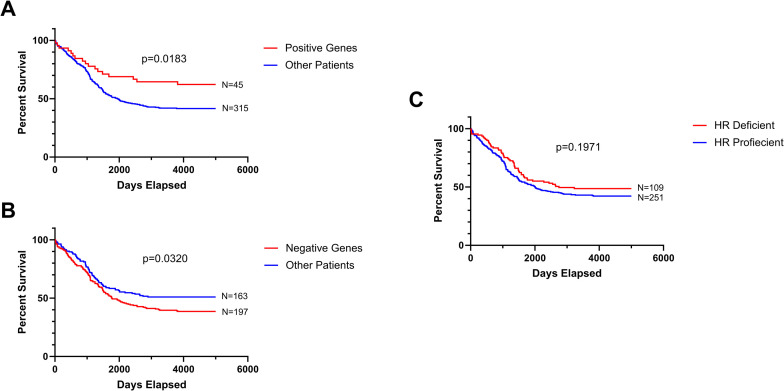
Fig 2. Kaplan-meier survival analysis of 360 EOC patients.
Kaplan-Meier survival analysis was performed on the basis of stratified patient populations containing mutations in positive genes (BRCA1, NBN, BRIP1, RAD50, PTEN, and PMS2) (A), negative genes (FANCE, FOXM1, KRAS, FANCD2, TTN, and CSMD3) (B), and HR-deficient genes (BRCA1, BRCA2, ATM, ATR, BRIP1, CDK12, CHEK2, FANCD2, FANCE, MRE11, NBN, PALB2, and RAD50) (C). The number of patients stratified (N) was also shown.

