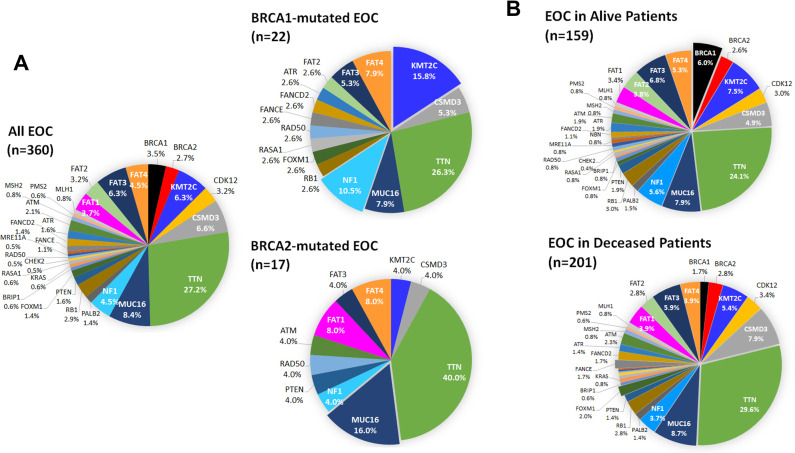
Fig 3. Mutation frequency in EOC populations.
A) Gene mutation spectrums of BRCA1- and BRCA2-mutated EOC. The percentages of 30 gene mutations are displayed in all, BRCA1-mutated, and BRCA2-mutated EOC cases. B) Gene mutation spectrums of EOC in alive and deceased patients. The percentages of 30 gene mutations are displayed for alive and deceased EOC patients. TP53 mutations are not included in the pie charts because these mutations are present in 96.4% of patients.

