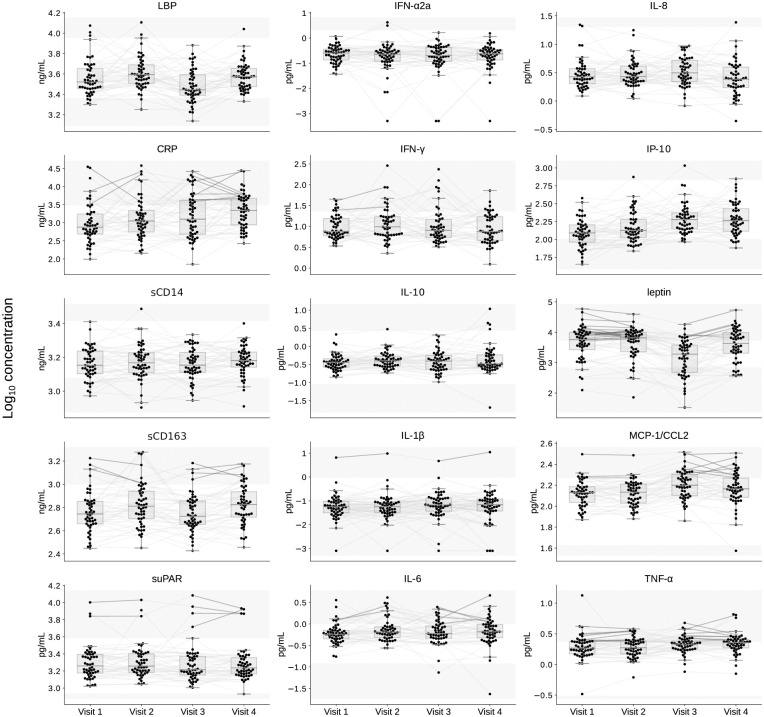
Fig 1. Plasma biomarker levels.
Each biomarker evaluated is shown in a separate panel, with normal upper and lower ranges indicated between the shaded areas. The biomarker levels are plotted for all participants’ (N = 50) two timepoints prior to HIV infection (pre-acquisition), Visit 1 and Visit 2; and two timepoints post-ART-suppression (>6 months and >2 years post ART suppression of plasma HIV RNA to <200 c/mL), Visit 3 and Visit 4. Gray lines connect measurements from the same participant. Lines are bolded if both pre-acquisition or post-ART-suppression values are above the normal range for a given biomarker. Abbreviations: suPAR, soluble urokinase-type plasminogen activator receptor; sCD14 and sCD163, soluble cluster of differentiation 14 and 163; LBP, lipopolysaccharide binding protein; IL-1 β, IL-6, IL-8 and IL-10, interleukin 1b, 6, 8 and 10; IFN-γ and IFN-α2a, interferon-gamma and -alpha 2a; IP-10, interferon gamma-induced protein 10; MCP-1/CCL2, monocyte chemoattractant protein-1; TNF-α, tumor necrosis factor-alpha; CRP, C-reactive protein.

