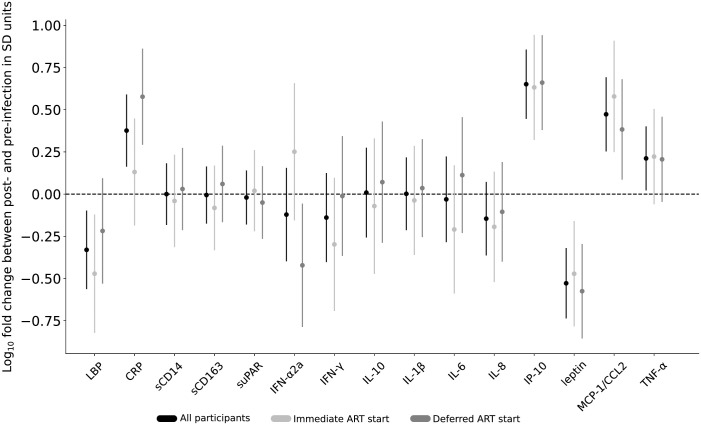
Fig 2. Difference between pre-HIV-infection and post-ART suppression biomarker values by timing of antiretroviral therapy (ART) initiation.
Biomarker levels from two specimens before HIV infection and two after ART-suppression were separately compared for all participants (shown in black (N = 47)), and participants separated into two groups: those who started ART immediately upon HIV-diagnosis in light gray (N = 21) vs. those who deferred ART initiation for 24 weeks in dark gray (N = 26), with mean differences (dots) and 95% confidence intervals (CI; lines) shown. The 95% confidence intervals were calculated based on a regression analysis with values log10 transformed prior to analysis and differences divided by pre-infection standard deviation for each analyte. This scaling of each analyte to the z scale facilitates presenting them together on a common figure and has no impact on statistical significance, which is communicated here by the CI not crossing the horizontal dotted line at zero. This line reflects no difference between post- and pre-infection values. Estimates and confidence intervals can be interpreted as a log10 fold-change difference between the two conditions expressed in units of the pre-infection standard deviation of a given analyte (expected fold-change pre-challenge). Abbreviations: suPAR, soluble urokinase-type plasminogen activator receptor; sCD14 and sCD163, soluble cluster of differentiation 14 and 163; LBP, lipopolysaccharide binding protein; IL-1β, IL-6, IL-8 and IL-10, interleukin 1b, 6, 8 and 10; IFN-γ and IFN-α2a, interferon-gamma and -alpha 2a; IP-10, interferon gamma-induced protein 10; MCP-1/CCL2, monocyte chemoattractant protein-1; TNF-α, tumor necrosis factor-alpha; CRP, C-reactive protein.

