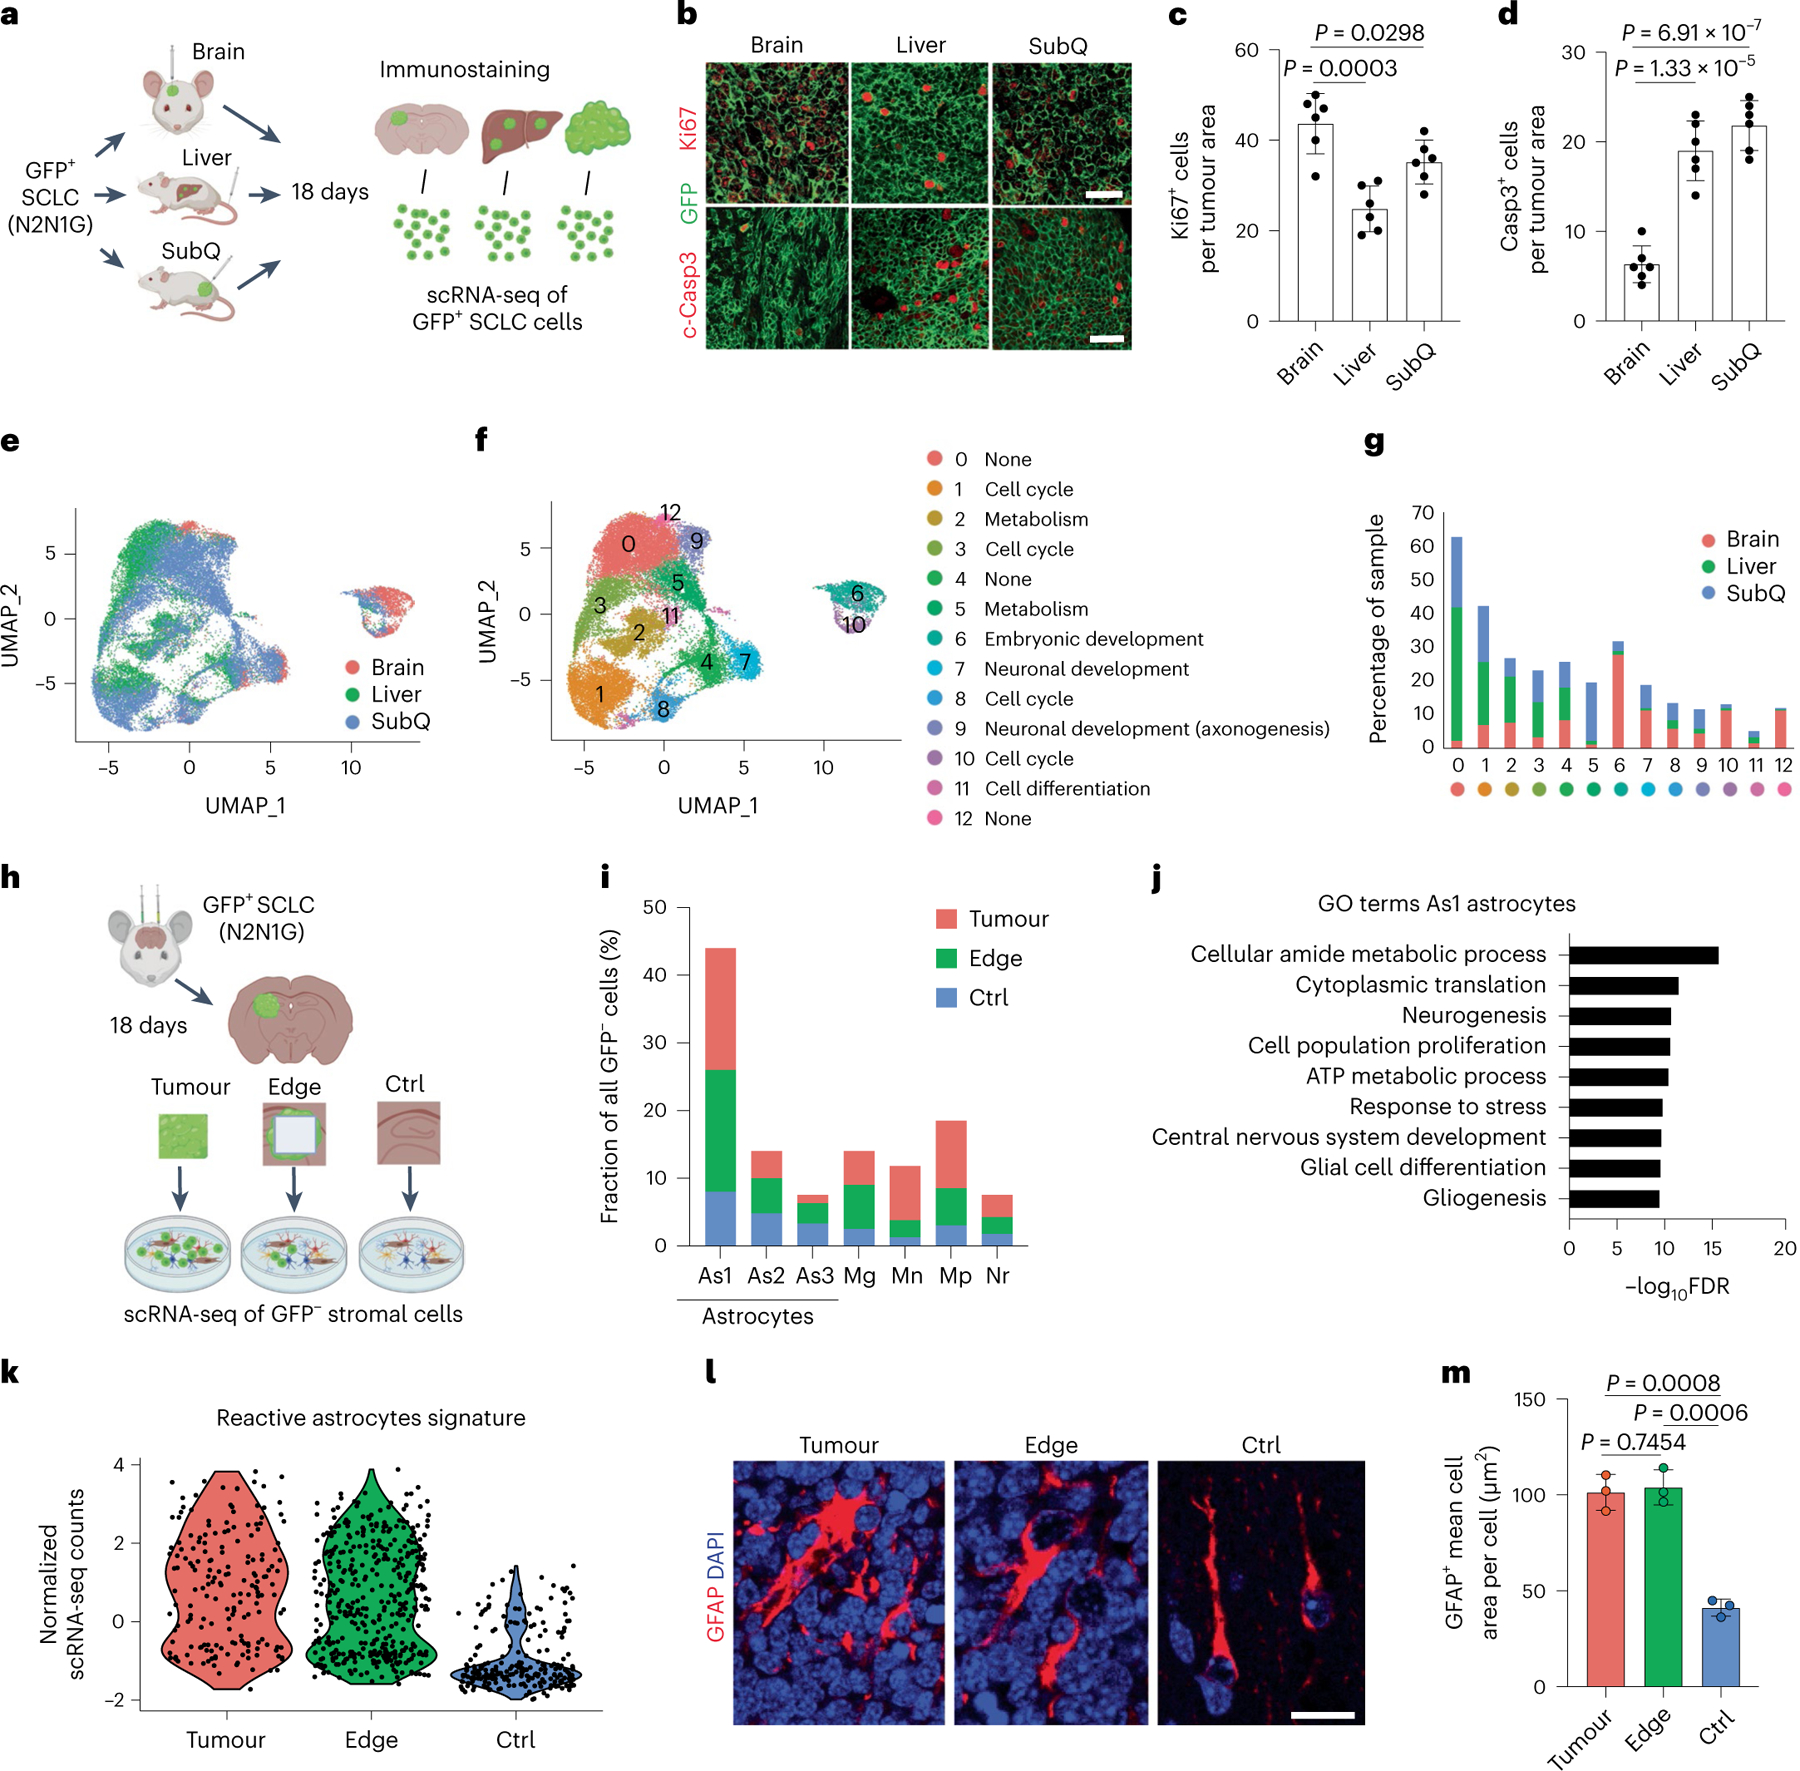
Fig. 1 |. Brain developmental programmes are reactivated in cancer cells and stromal cells in an SCLC brain metastasis model.

a, Schematic description of the analysis of mouse N2N1G SCLC cells expressing GFP growing in brain, liver and subcutaneous tumours (SubQ). b–d, Representative images (b) and quantification of immunofluorescence staining for Ki67 (c), cleaved caspase-3 (Casp3) (d) and N2N1G cells (GFP) on tumour sections (quantification is number of positive cells per area quantified = 2 × 104 μm2) as in (a) (n = 6 tumours from 2 independent experiments). Scale bars, 20 μm. e, UMAP analysis of scRNA-seq data from N2N1G cells isolated from brain, liver and subcutaneous allografts. f,g, Distribution of N2N1G cells isolated from brain, liver and subcutaneous allografts on the UMAP analysis plot (f) and the percentage of cells in each cluster (g). h, Schematic representation of the analysis of stromal cells from N2N1G brain allografts. The site without cancer cells (control (Ctrl)) also underwent surgery and sham injection. i, The percentage of specific cell types in GFP− stromal cells from the tumour core, tumour edge and sham control. As1, astrocyte 1; As2, astrocyte 2; As3, astrocyte 3; Mg, microglia; Mn, monocyte; Mp, macrophage; Nr, neutrophil (see Extended Data Fig. 2d for all cell populations). j, GO enrichment for genes that are upregulated in astrocyte population 1 (As1). FDR, false discovery rate. k, Expression of a reactive astrocyte signature from scRNA-seq data of astrocytes isolated from an N2N1G brain tumour, its tumour edge and sham injection control brain. n = 3 biologically independent samples. l, Representative images showing immunofluorescence staining of GFAP (astrocytes) from N2N1G brain tumours (tumour core and edge) or control brain regions. Blue, DAPI DNA stain. Scale bar, 20 μm. m, Cell area of GFAP+ astrocytes as in (l). n = 3 tumours from 3 mice. Data are mean ± s.d. P values calculated by two-sided t-test.
