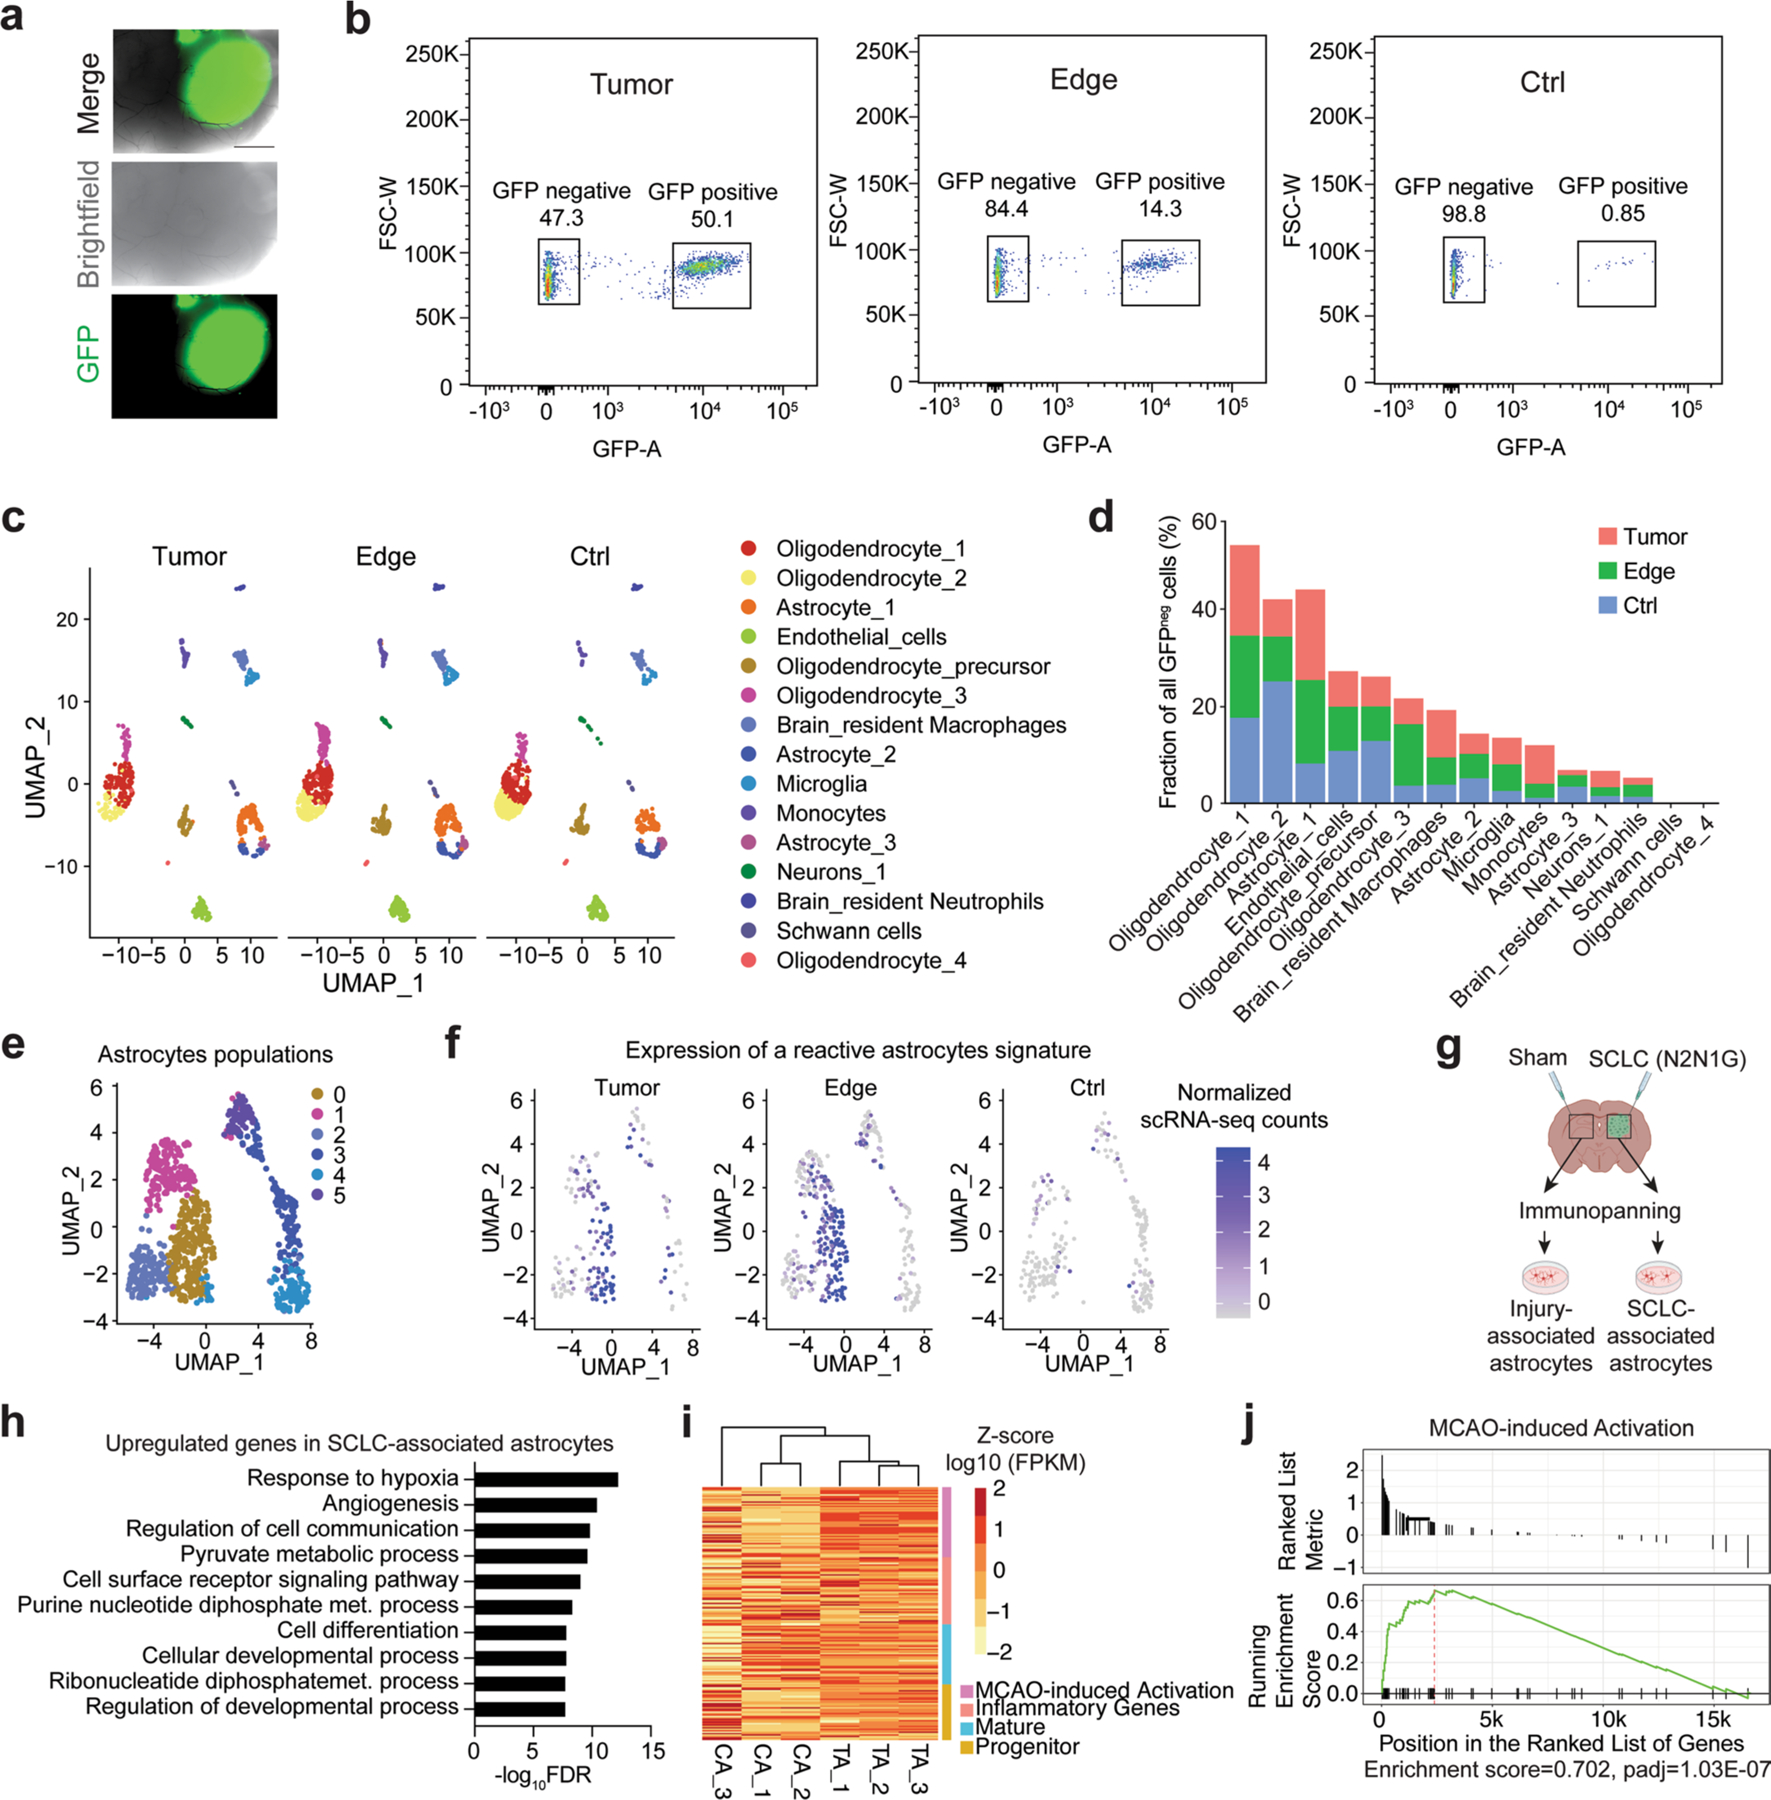
Extended Data Fig. 2 |. Reactivation of astrocytes in mouse SCLC brain metastases analyzed by RNA sequencing.

a. Representative fluorescent image of an N2N1G mouse brain allograft (cancer cells are GFP+) 18 days post-injection. Similar results were observed from 6 biologically independent samples from 2 experiments. Scale bar, 1 mm. b. Representative flow cytometry data of all GFP+ cells isolated from an N2N1G brain tumor core, its edge, and the sham control side. c. Uniform Manifold Approximation and Projection (UMAP) analysis of scRNA-seq of GFPneg stromal cells isolated from an N2N1G brain tumor core, its edge, and the sham control side. d. Percentage of each cell type in GFPneg stromal cell populations as in (c). e. Uniform Manifold Approximation and Projection (UMAP) of astrocyte populations from scRNA-seq data from (c). More than 3 populations of astrocytes as in (d) were found when the analysis was focused on astrocytes. f. Expression plot of reactive astrocyte signature genes in astrocyte populations within tumors, at the tumor edge, and in sham injection control regions. g. Schematic representation of the immunopanning protocol to isolate SCLC-associated and injury-associated (surgery and sham injection) control astrocytes before bulk RNA sequencing and analysis. Astrocytes were isolated from the two sides of the brain of the same mice (N2N1G allograft model). Created with BioRender.com h. Gene ontology (GO) enrichment (top 10) for the genes that are upregulated in tumor-associated astrocytes (TA) compared to control astrocytes (CA) as in (g). FDR, false discovery rate. i. Gene expression heatmap of TA and CA grouped by signature genes of alternative activation, inflammatory genes, mature, and progenitor astrocytes (RNA-seq). j. Gene Set Enrichment Analysis (GSEA) for an MCAO (middle cerebral artery occlusion)-induced activation signature (Heiland et al., 2019) for genes upregulated in N2N1G brain TA compared to CA.
