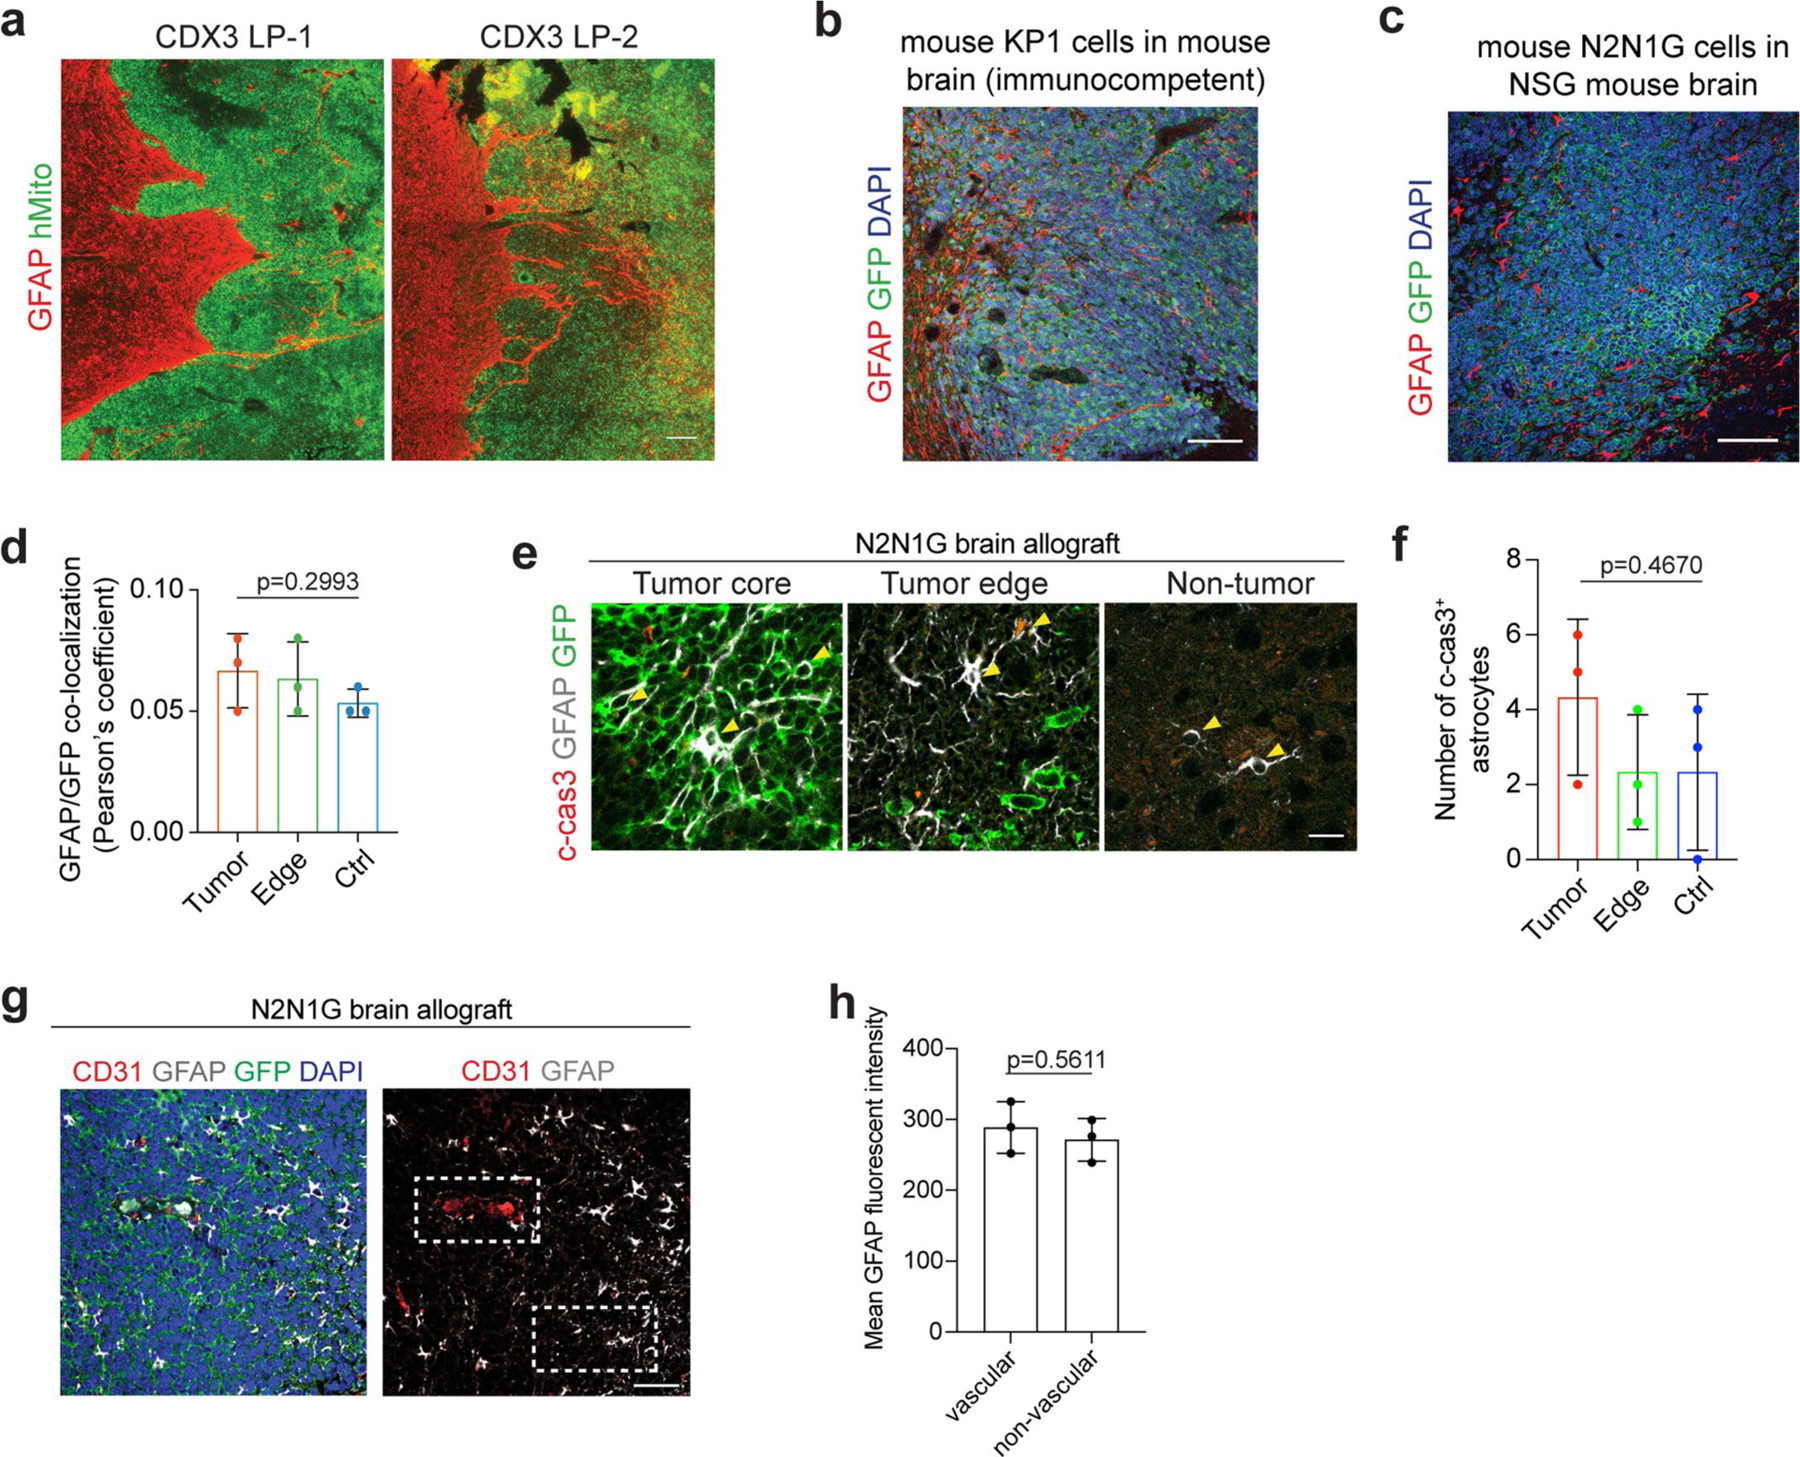
Extended Data Fig. 3 |. Reactive astrocytes infiltrate SCLC brain metastases in mice and humans.

a. Representative images showing immunofluorescent staining of GFAP (red, astrocytes) and human mitochondria (hMito, green, SCLC CDX3 xenograft model) on sections from a leptomeningeal metastasis (LP). Scale, 100 μm. Similar results were observed from 3 biologically independent samples. b. Representative images showing immunofluorescent staining of GFAP (red) and GFP (green for SCLC cells) on sections from an immunocompetent mouse SCLC allograft model (KP1-GFP cells). Similar results were observed from 4 biologically independent samples. Blue, DAPI DNA stain. Scale, 50 μm. c, d. Representative images (c) showing immunofluorescent staining of GFAP (red) and GFP+ N2N1G SCLC cells (green) and quantification (d) of colocalization (Pearson’s coefficient for the red and green channels). n = 3 biologically independent samples. Blue, DAPI DNA stain. Scale, 50 μm. e, f. Representative immunofluorescent staining images (e) and quantification (f) of cleaved-caspase 3 (c-cas3) expression on a section from a GFP+ N2N1G SCLC brain allograft. n = 3 biologically independent samples. P values calculated by one-way ANOVA for (d) and (f). g-h. Representative immunofluorescent staining images (g) and quantification (h) of perivascular and non-perivascular astrocytes (GFAP+). CD31 stains endothelial cells in the vasculature. n = 3 biologically independent samples. Data show mean with SD. P values calculated by two-sided t-test when comparing two groups and one-way ANOVA when comparing three and more groups.
