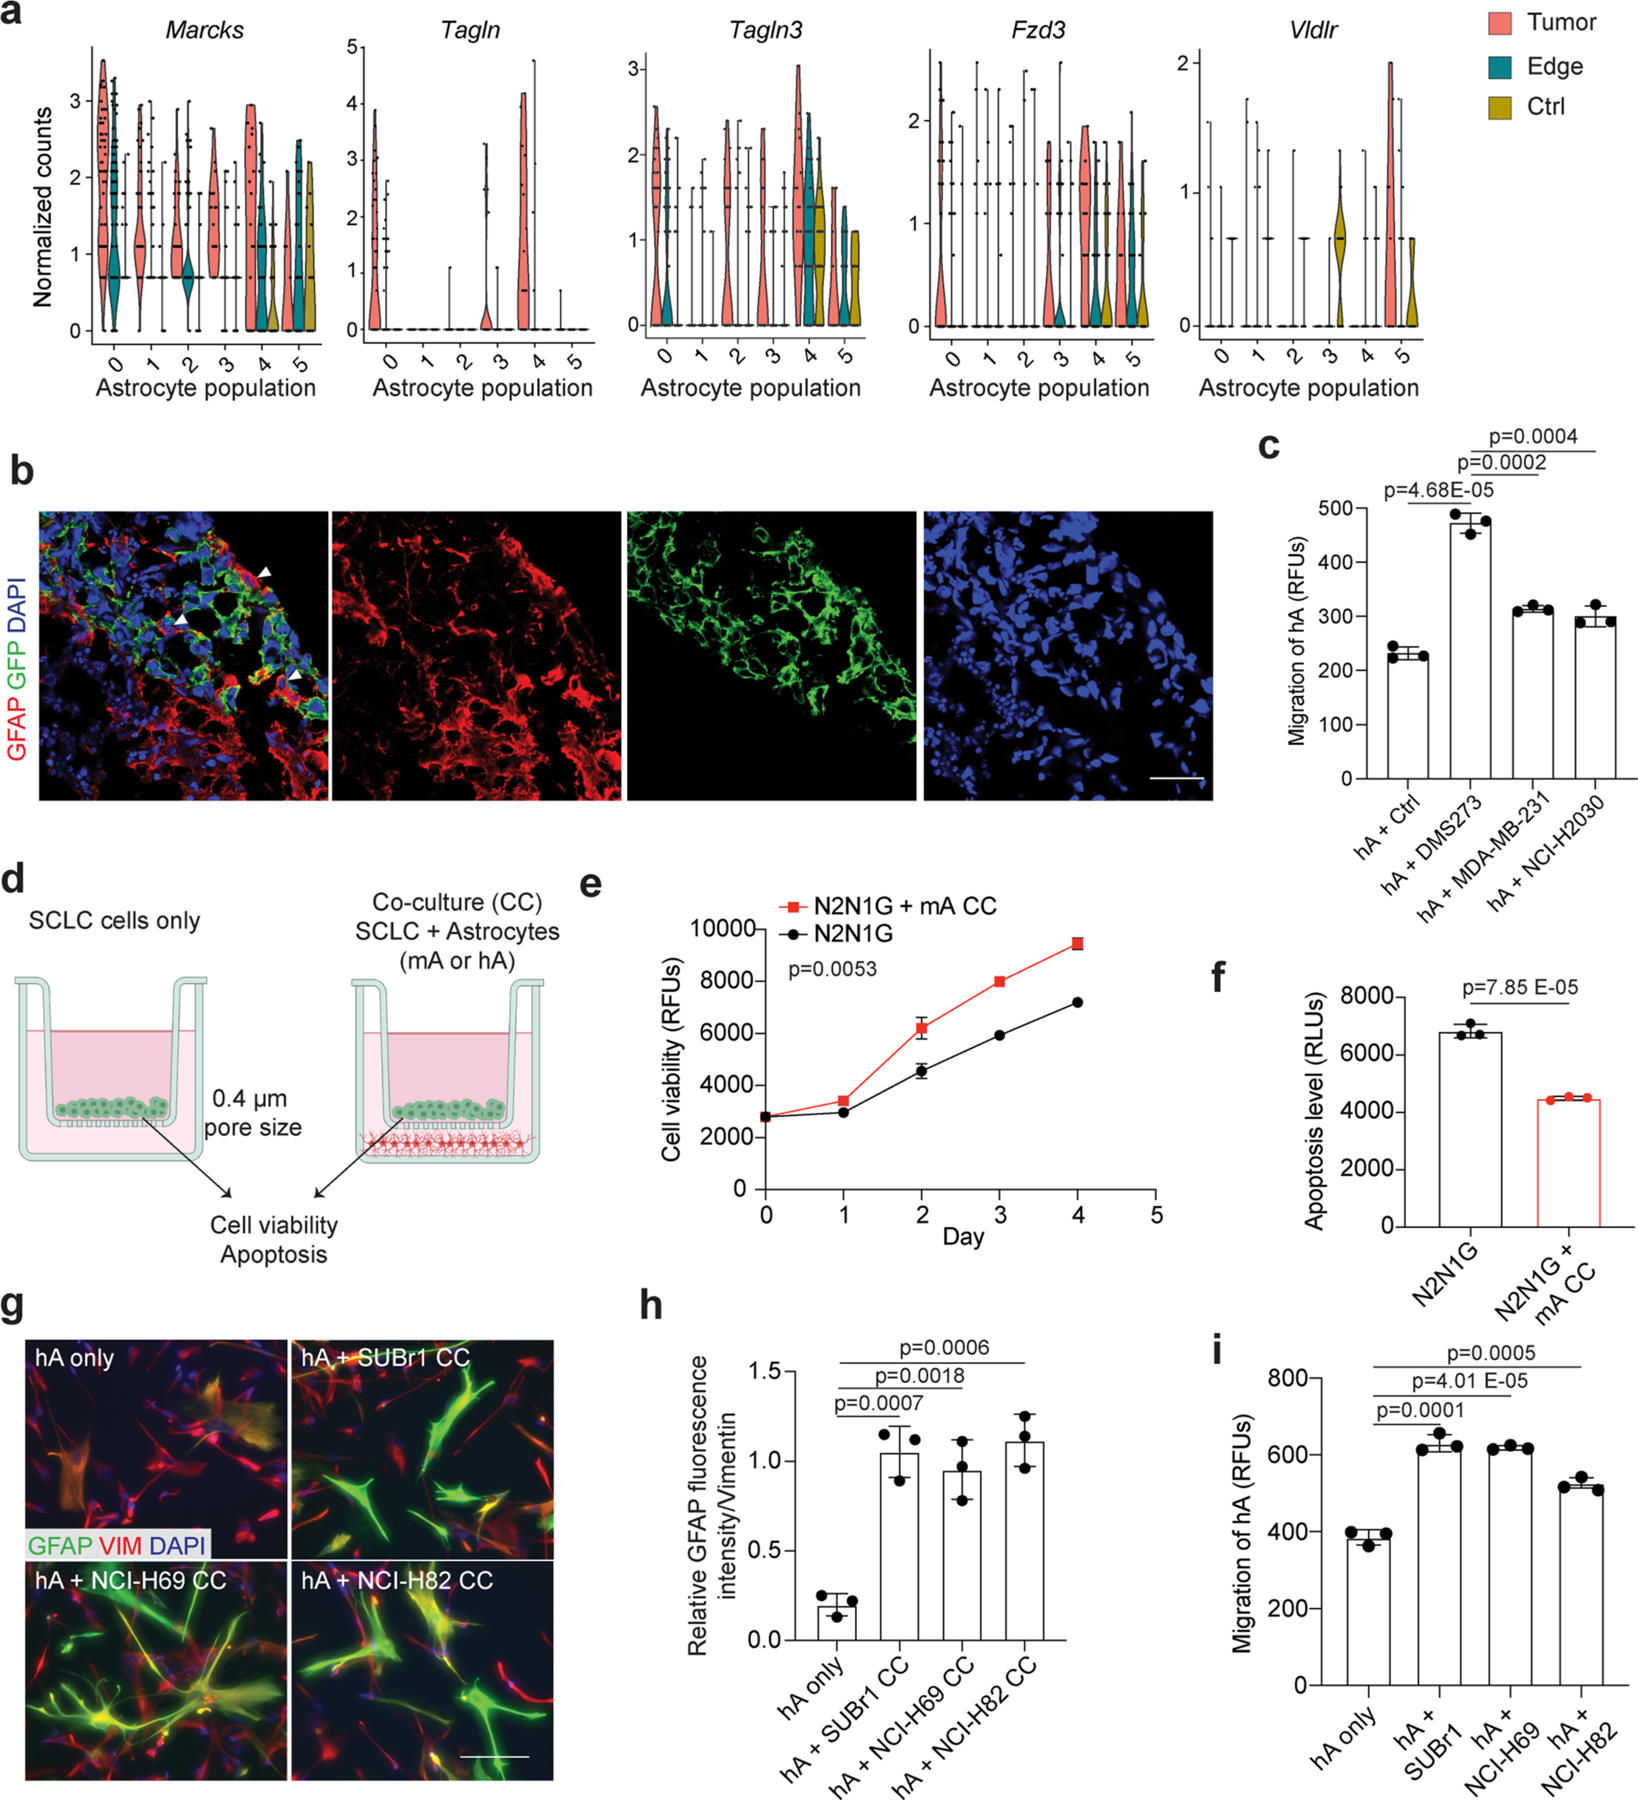
Extended Data Fig. 4 |. Astrocytes activated by SCLC cells promote the growth and survival of mouse and human SCLC cells.

a. Expression of upregulated cell migration genes in astrocyte populations (as in Extended Data Fig. 2e) from tumor or tumor edge compared to a sham injection control. n = 3 animals. b. Representative high magnification images of immunofluorescent staining of GFAP (red) and GFP (green for human cancer cells) at an SCLC-hCO assembloid fusion interface showing the cell body of astrocytes within the SCLC aggregate. Showing separate channel images from Fig. 3d. Scale, 20 μm. c. Quantification of human astrocyte chemotaxis in control medium and human cancer cell-conditioned medium. d. Schematic description of the astrocyte-SCLC co-culture assay. Created with BioRender.com e, f. Cell viability (AlamarBlue assay, RFU: relative fluorescent unit) (d) and apoptosis (caspase3/7 activity, RLU: relative luminescence unit) (e) measured in N2N1G cells cultured with (red) or without (black) mouse astrocytes (mA). n = 3 independent experiments. g. Representative images showing immunofluorescent staining of human astrocytes (hA) cultured alone or co-cultured with human SCLC cell lines (SUBr1, NCI-H69, and NCI-H82). GFAP (green), Vimentin (VIM, red). Blue, DAPI DNA stain. Scale, 20 μm. h. Quantification of GFAP fluorescent intensity relative to Vimentin (n = 6 from 3 independent experiments). i. Quantification of hA chemotaxis toward human SCLC-conditioned medium. N = 3 independent experiments. Data show mean with SD. P values calculated by two-sided t-test for (c)(f)(h)(i), and two-way ANOVA for (e).
