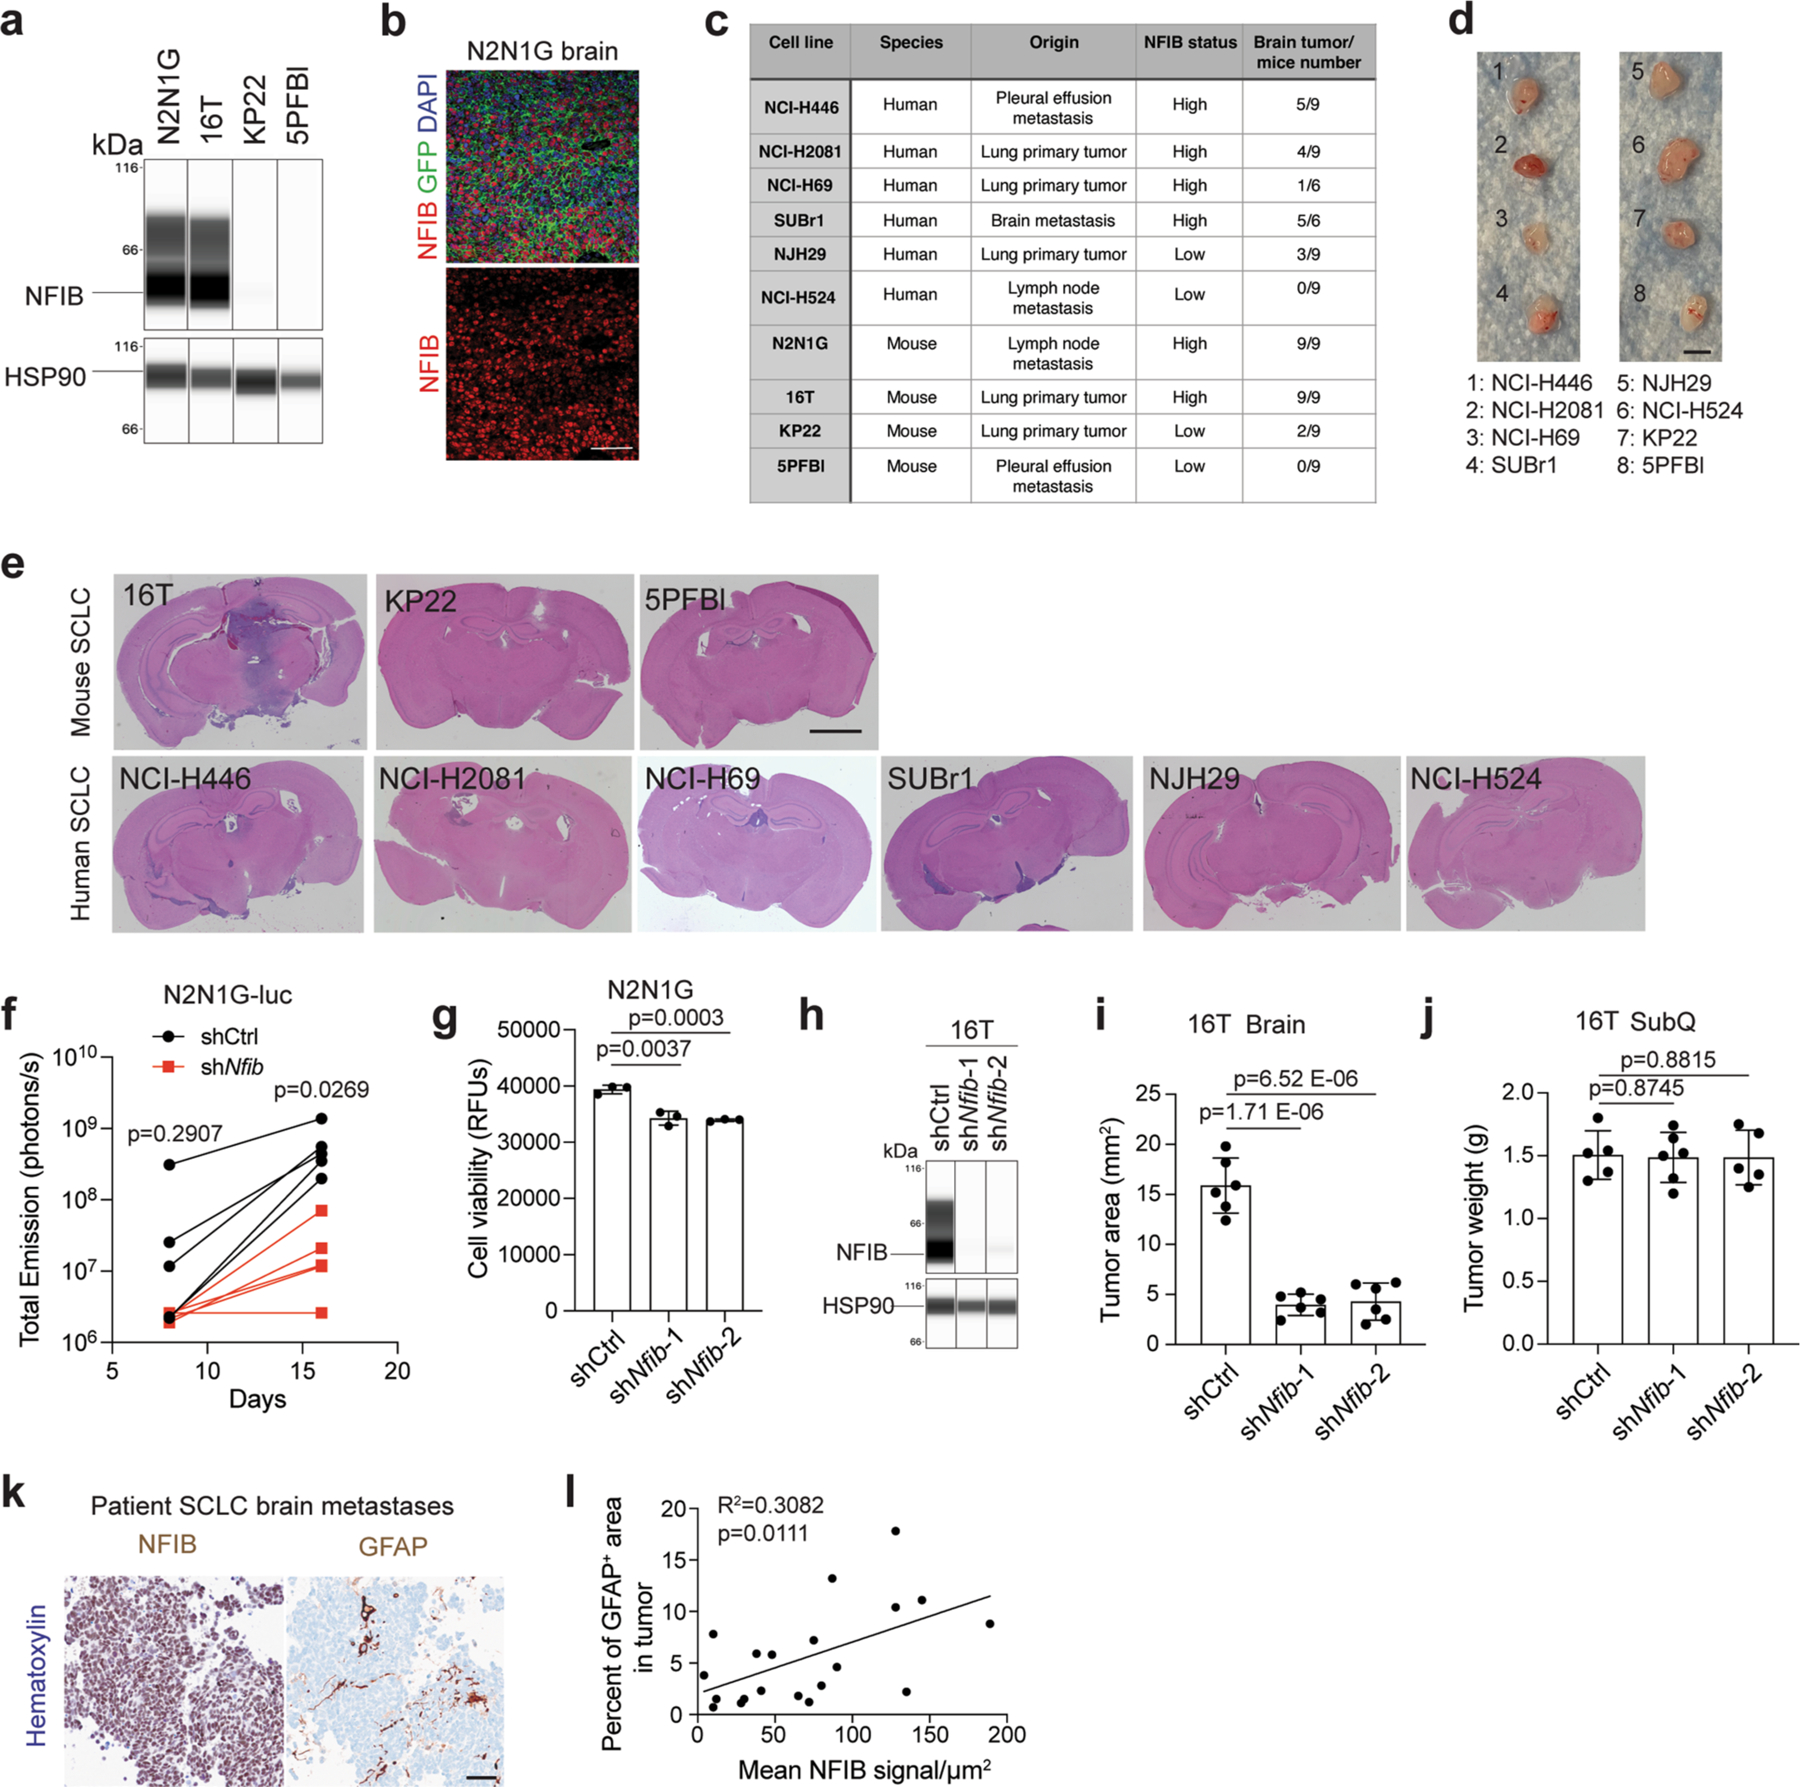
Extended Data Fig. 6 |. Correlation between NFIB levels and the growth of SCLC brain metastases.

a. Immunoassay (by WES capillary transfer) for NFIB expression in NFIB-high 16 T and N2N1G mouse SCLC cells and in NFIB-low KP22 and 5PFBl cells. HSP90 serves as a loading control. Similar results were observed from 2 independent experiments. b. Representative image of immunofluorescent staining for NFIB (red) and N2N1G NFIB-high SCLC cells (green) on sections from a brain allograft (right). Similar results were observed from 3 biologically independent samples. Scale bar, 20 μm. c. Summary of the ability of various mouse and human SCLC tumors to grow in the brain following intra-cranial injection and subcutaneously. d. Representative images of subcutaneous xenografts and allografts from models in (c) after 14 days in NSG mice. Scale bar, 5 mm. e. Representative images of brains sections from models in (c) after 21 days. f. Quantification of tumor growth of shCtrl (control) and shNfib N2N1G-luc cells measured by bioluminescence imaging (n = 5 tumors from 5 mice each genotype). g. Cell viability measured by AlamarBlue assay of shCtrl and shNfib N2N1G cells at 48 hours in culture. n = 3 independent experiments. h. Immunoassay for NFIB expression in 16 T cells with control and shNfib shRNAs (n = 1 experiment). HSP90: loading control. i-j. Quantification of tumor size of control and shNfib 16 T brain allografts (i) and subcutaneous allografts ( j). n = 5 (control and shNfib-2) and 6 (shNfib-1) mice from 2 experiments. k. Representative immunohistochemistry (IHC) for NFIB and GFAP expression (brown signal) in brain metastases sections from SCLC patients. Scale bar, 50 μm. l. Quantification of (k) (n = 20 regions from 10 patient metastases) for GFAP staining area and NFIB intensity (brown signal). Data show mean with SD. P-values calculated by two-sided t-test when comparing two groups and by one-way ANOVA when comparing three groups.
