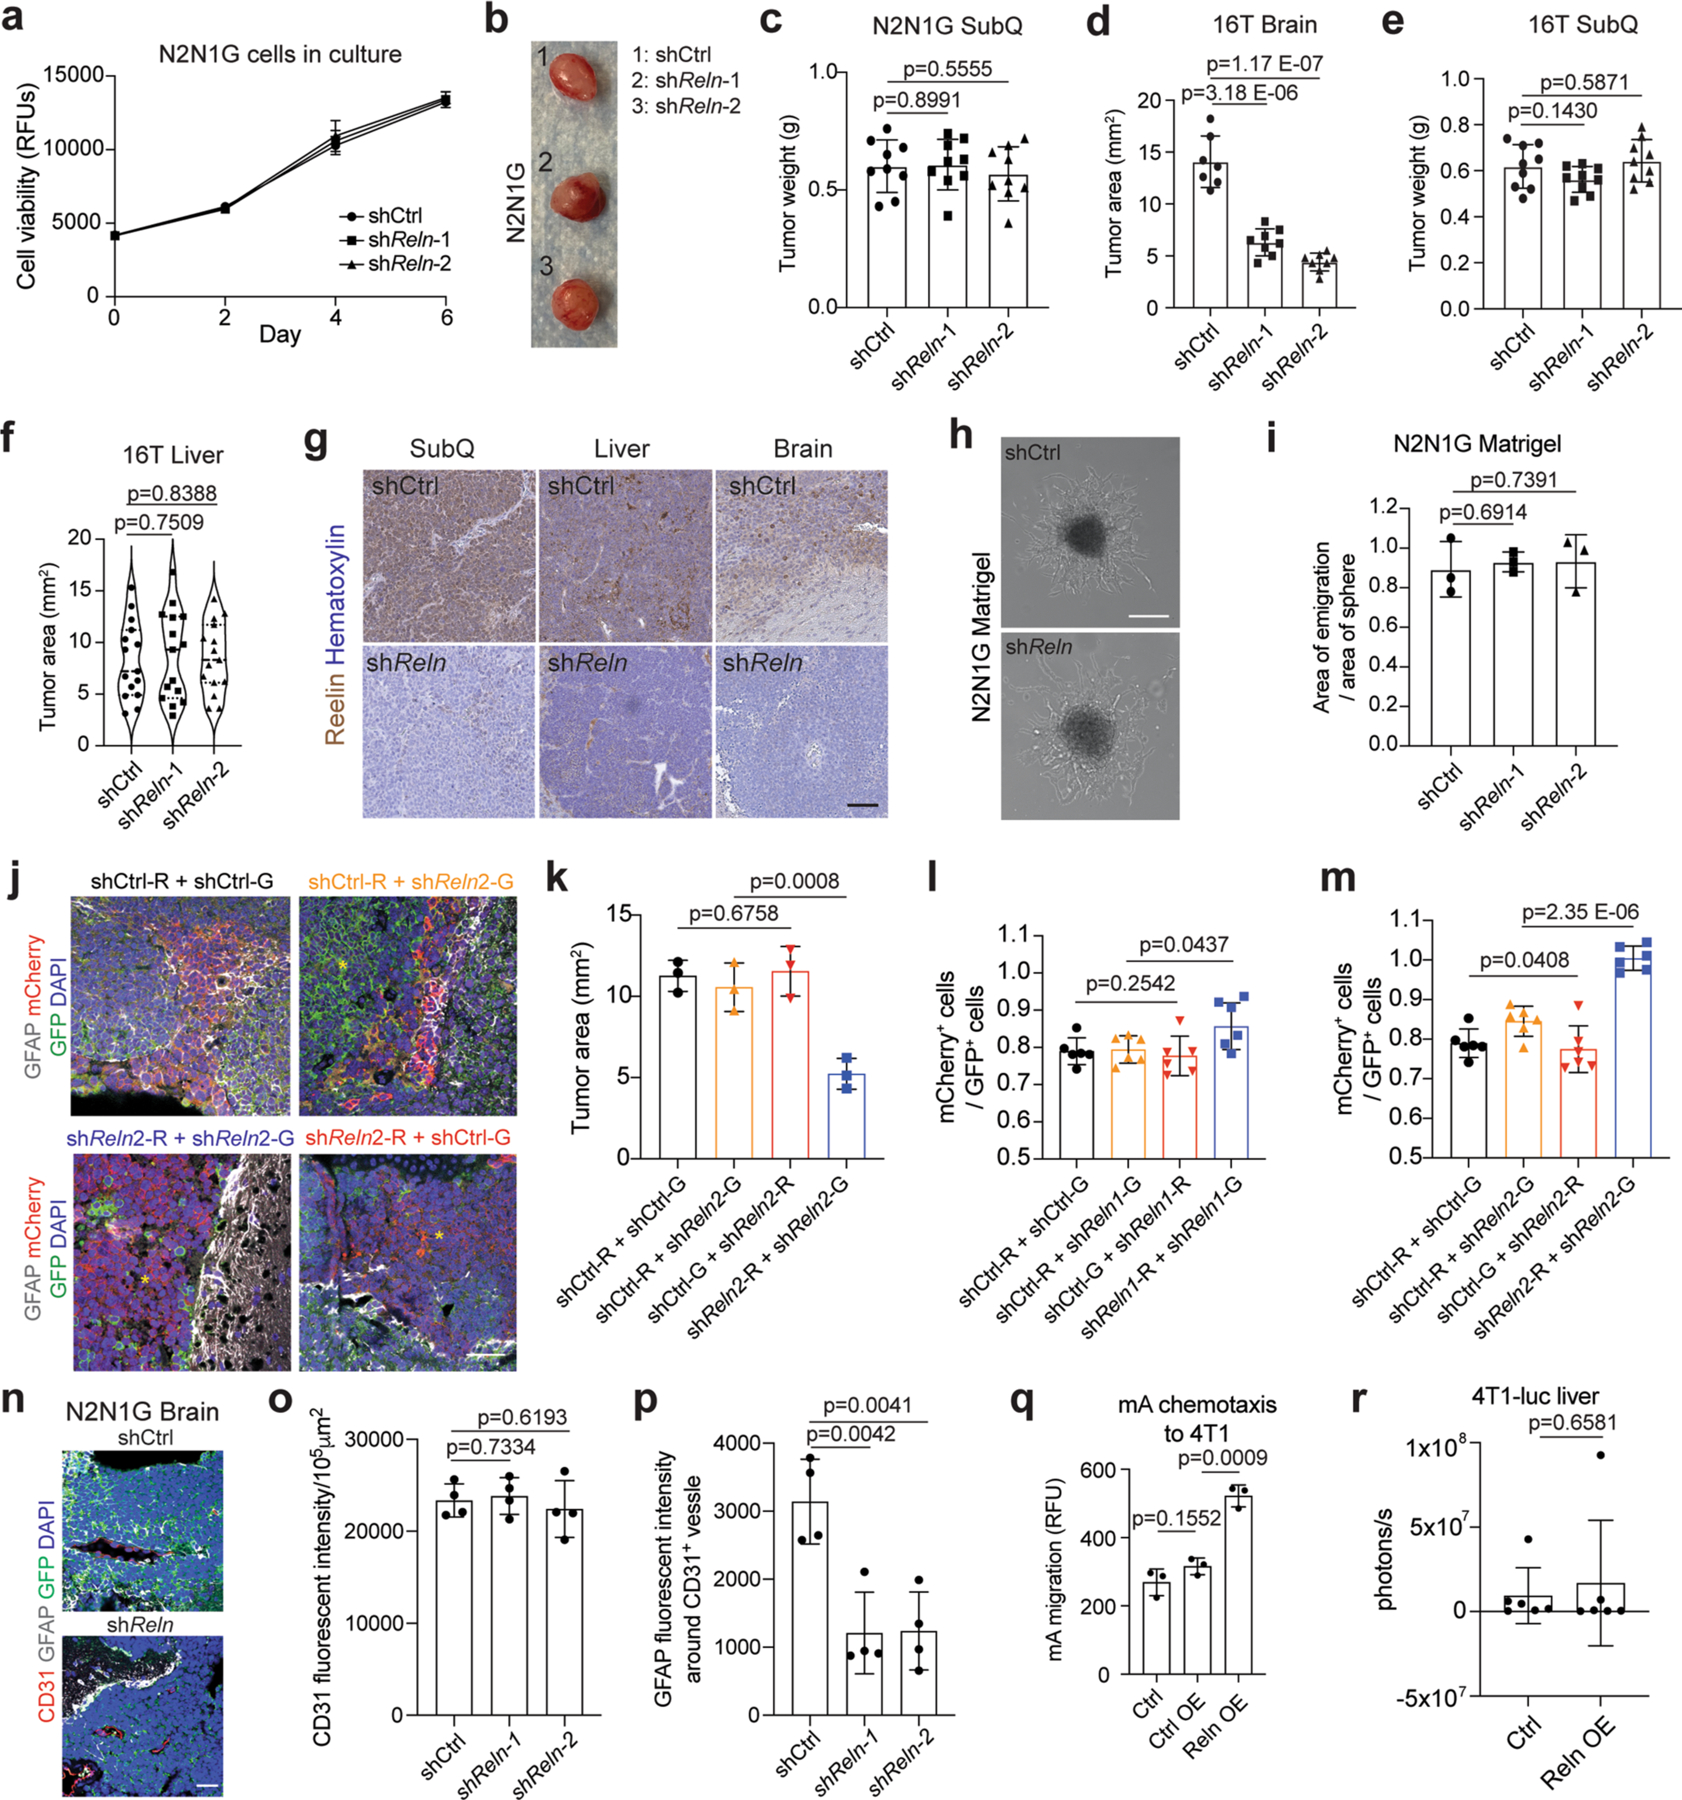
Extended Data Fig. 9 |. Reelin expression is critical for the recruitment of GFAP+ astrocytes and the growth of SCLC brain metastases.

a. Cell viability of shCtrl (control) and shReln N2N1G cells measured by AlamarBlue assay (n = 3). b, c. Representative image and tumor size of shCtrl and shReln N2N1G subcutaneous allografts 21 days post-transplant. Scale bar, 5 mm. N = 9 from 2 experiments. d-f. Tumor size of shCtrl and shReln 16 T brain allografts (d), subcutaneous allografts (e), and liver metastases (f) 21 days post-transplant. N = 7 (shCtrl) and 8 (shReln) from 2 experiments in (d). N = 9 mice from 3 experiments in (e) and (f). g. Representative images of immunohistochemistry staining of Reelin (brown, with blue hematoxylin counterstain) on SCLC brain tumors generated by shCtrl and shReln N2N1G cells. Scale bar, 100 μm. Similar results were observed from 3 independent experiments. h-i. Representative images (h) and quantification (i, n = 3 independent experiments) of shCtrl and shReln SCLC cell migration from 3D cancer spheres in Matrigel. j. Representative images of immunofluorescent staining of GFAP (white) in SCLC brain tumors grown from a 1:1 mix of shCtrl and shReln2 16 T cells expressing mCherry (red) or GFP (green), as indicated. Blue: DAPI DNA stain. Scale bar, 20 μm. Yellow asterisk shows regions where astrocytes are absent. k. Quantification of tumor size in ( j). l-m. Quantification of the ratio between mCherry+ and GFP+ of 16T cells growing in the brain from (Fig. 6h and Extended Data Fig. 9j). N = 6 mice from 2 independent experiments. n. Representative images of immunofluorescent staining of CD31 and GFAP in shCtrl and shReln N2N1G brain allografts. GFP labels N2N1G cells, DAPI stain for nucleus. Scale bar, 20 μm. o-p. Quantification of CD31 level and perivascular GFAP-positive astrocytes in shCtrl and shReln N2N1G brain allografts. N = 4 tumors. q. Chemotaxis of mouse astrocytes in conditioned media from 4T1 cells, 4T1 cells expressing control vector, and 4T1 cells expressing mouse Reelin central domain. n = 3 independent experiments. r. Quantification of liver metastasis size by luciferase imaging of the abdomen of mice 14 days after intracardiac injections of 4T1 cells expressing control vector or mouse Reelin central domain (Leu1221-Ile 2661). N = 6 mice from 2 experiments. Data show mean with SD. P values calculated by two-sided t-test when comparing two groups and one-way ANOVA when comparing three or more groups.
