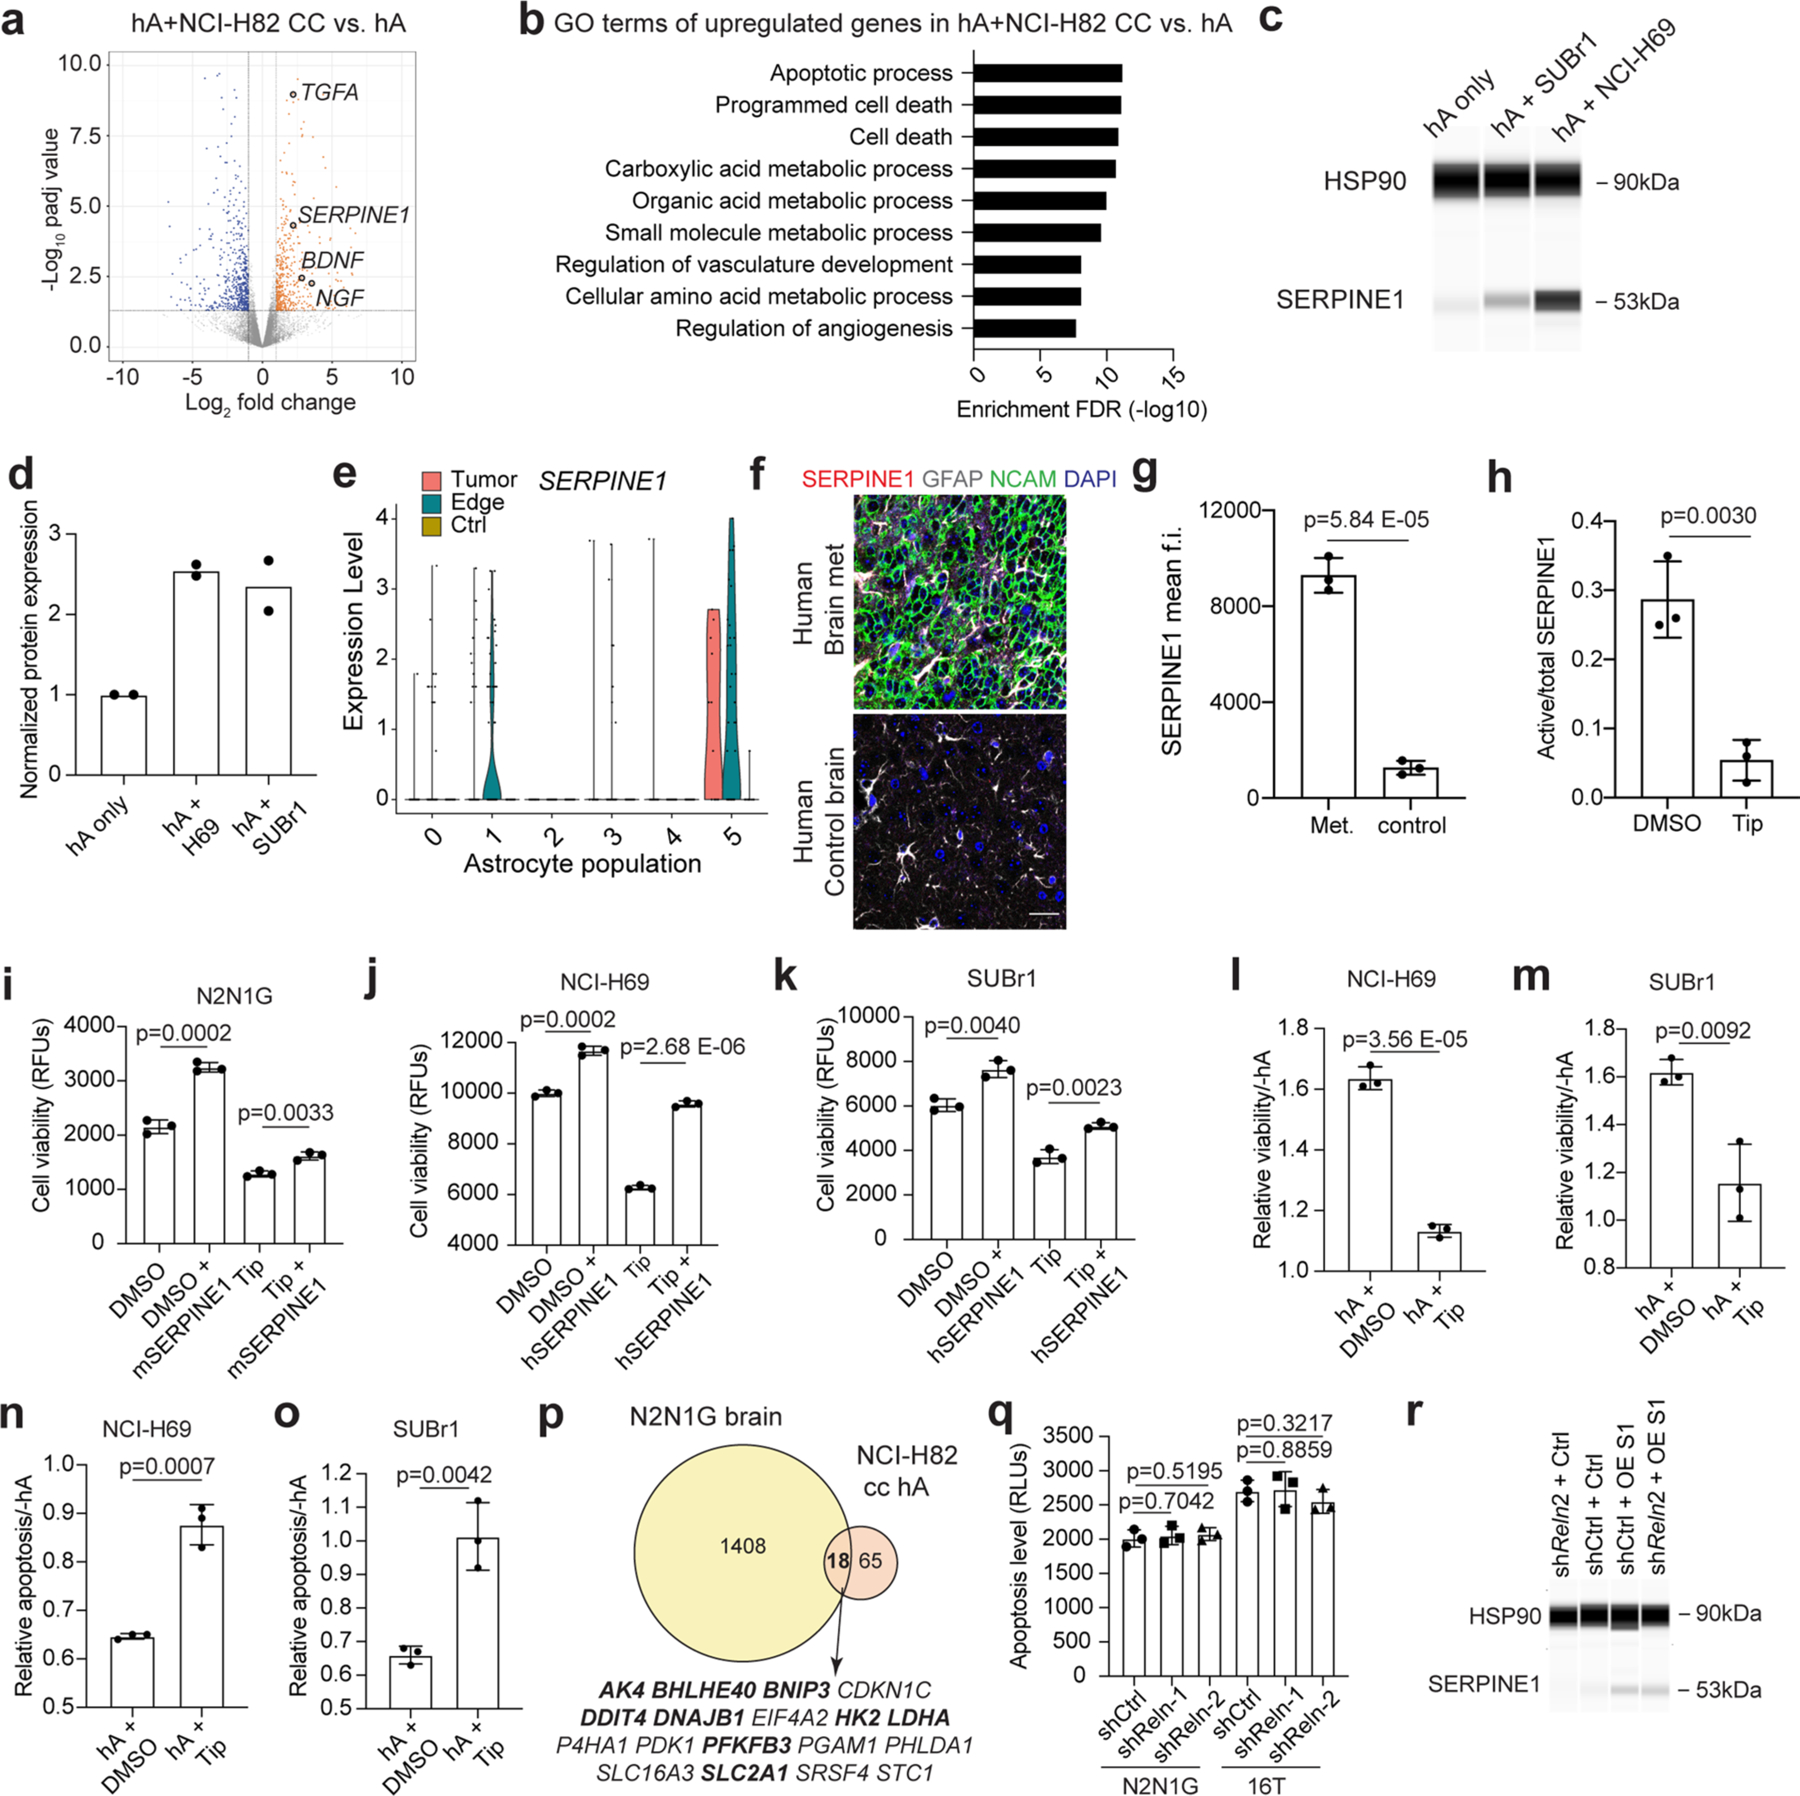
Extended Data Fig. 10 |. Astrocytes activated by SCLC cells secrete factors promoting the survival of SCLC cells.

a. Volcano plot showing differentially expressed genes in hA co-cultured with NCI-H82 compared to hA alone. b. Gene ontology (GO) enrichment (top 9) for the genes that are upregulated in hA co-cultured with NCI-H82 compared to hA alone. c. Immunoassay (by WES capillary transfer) for SERPINE1 expression in naive hA and hA co-cultured with the NCI-H69 and SUBr1 human SCLC cell lines. HSP90 serves as a loading control. d. Quantification of (c) (n = 2 independent experiments). e. The expression level of SERPINE1 in astrocyte populations (as in Extended Data Fig. 2f) from N2N1G brain allograft tumor, tumor edge, and sham control brain. n = 3 biologically independent samples. f-g. Representative images and quantification of immunofluorescent staining of SERPINE1 in patient SCLC brain metastases. NCAM stains SCLC cells. GFAP stains astrocytes. DAPI stains nucleus. Scale bar, 20 μm. n = 3 samples. h. Ratio of active SERPINE1 measured by ELISA in culture medium from mouse astrocytes co-cultured with N2N1G cells for 2 days and then treated with DMSO (control) and Tiplaxtinin (5 μM). i. Cell viability (AlamarBlue assay) measured in N2N1G cells treated with recombinant mSERPINE1 and Tip (n = 3 experiments). j, k. Cell viability (AlamarBlue assay) measured in NCI-H69 cells ( j) and SUBr1 cells (k) treated with recombinant hSERPINE1 and the SERPINE1 inhibitor Tiplaxtinin (Tip) (n = 3 experiments). l-m. Relative cell viability (AlamarBlue assay) measured in NCI-H69 cells (l) and SUBr1 cells (m) cultured with hA compared to without hA, with or without Tiplaxtinin treatment (n = 3 experiments). n-o. Relative apoptosis (caspase3/7 activity) measured in NCI-H69 cells (n) and SUBr1 cells (o) cultured with hA compared to without hA, with or without Tip treatment (n = 3 experiments). p. Overlap between upregulated genes in NCI-H82 cultured with hA and N2N1G cells growing in the brain compared to subcutaneously. q. Apoptosis measured by cleaved caspase3/7 in shCtrl (control) and shReln N2N1G and 16T cells in culture. r. Immunoassay for SERPINE1 expression in N2N1G cells in Fig. 7m, n. Data show mean with SD. P values calculated via two-sided t-test when comparing two groups and one-way ANOVA when comparing three groups.
