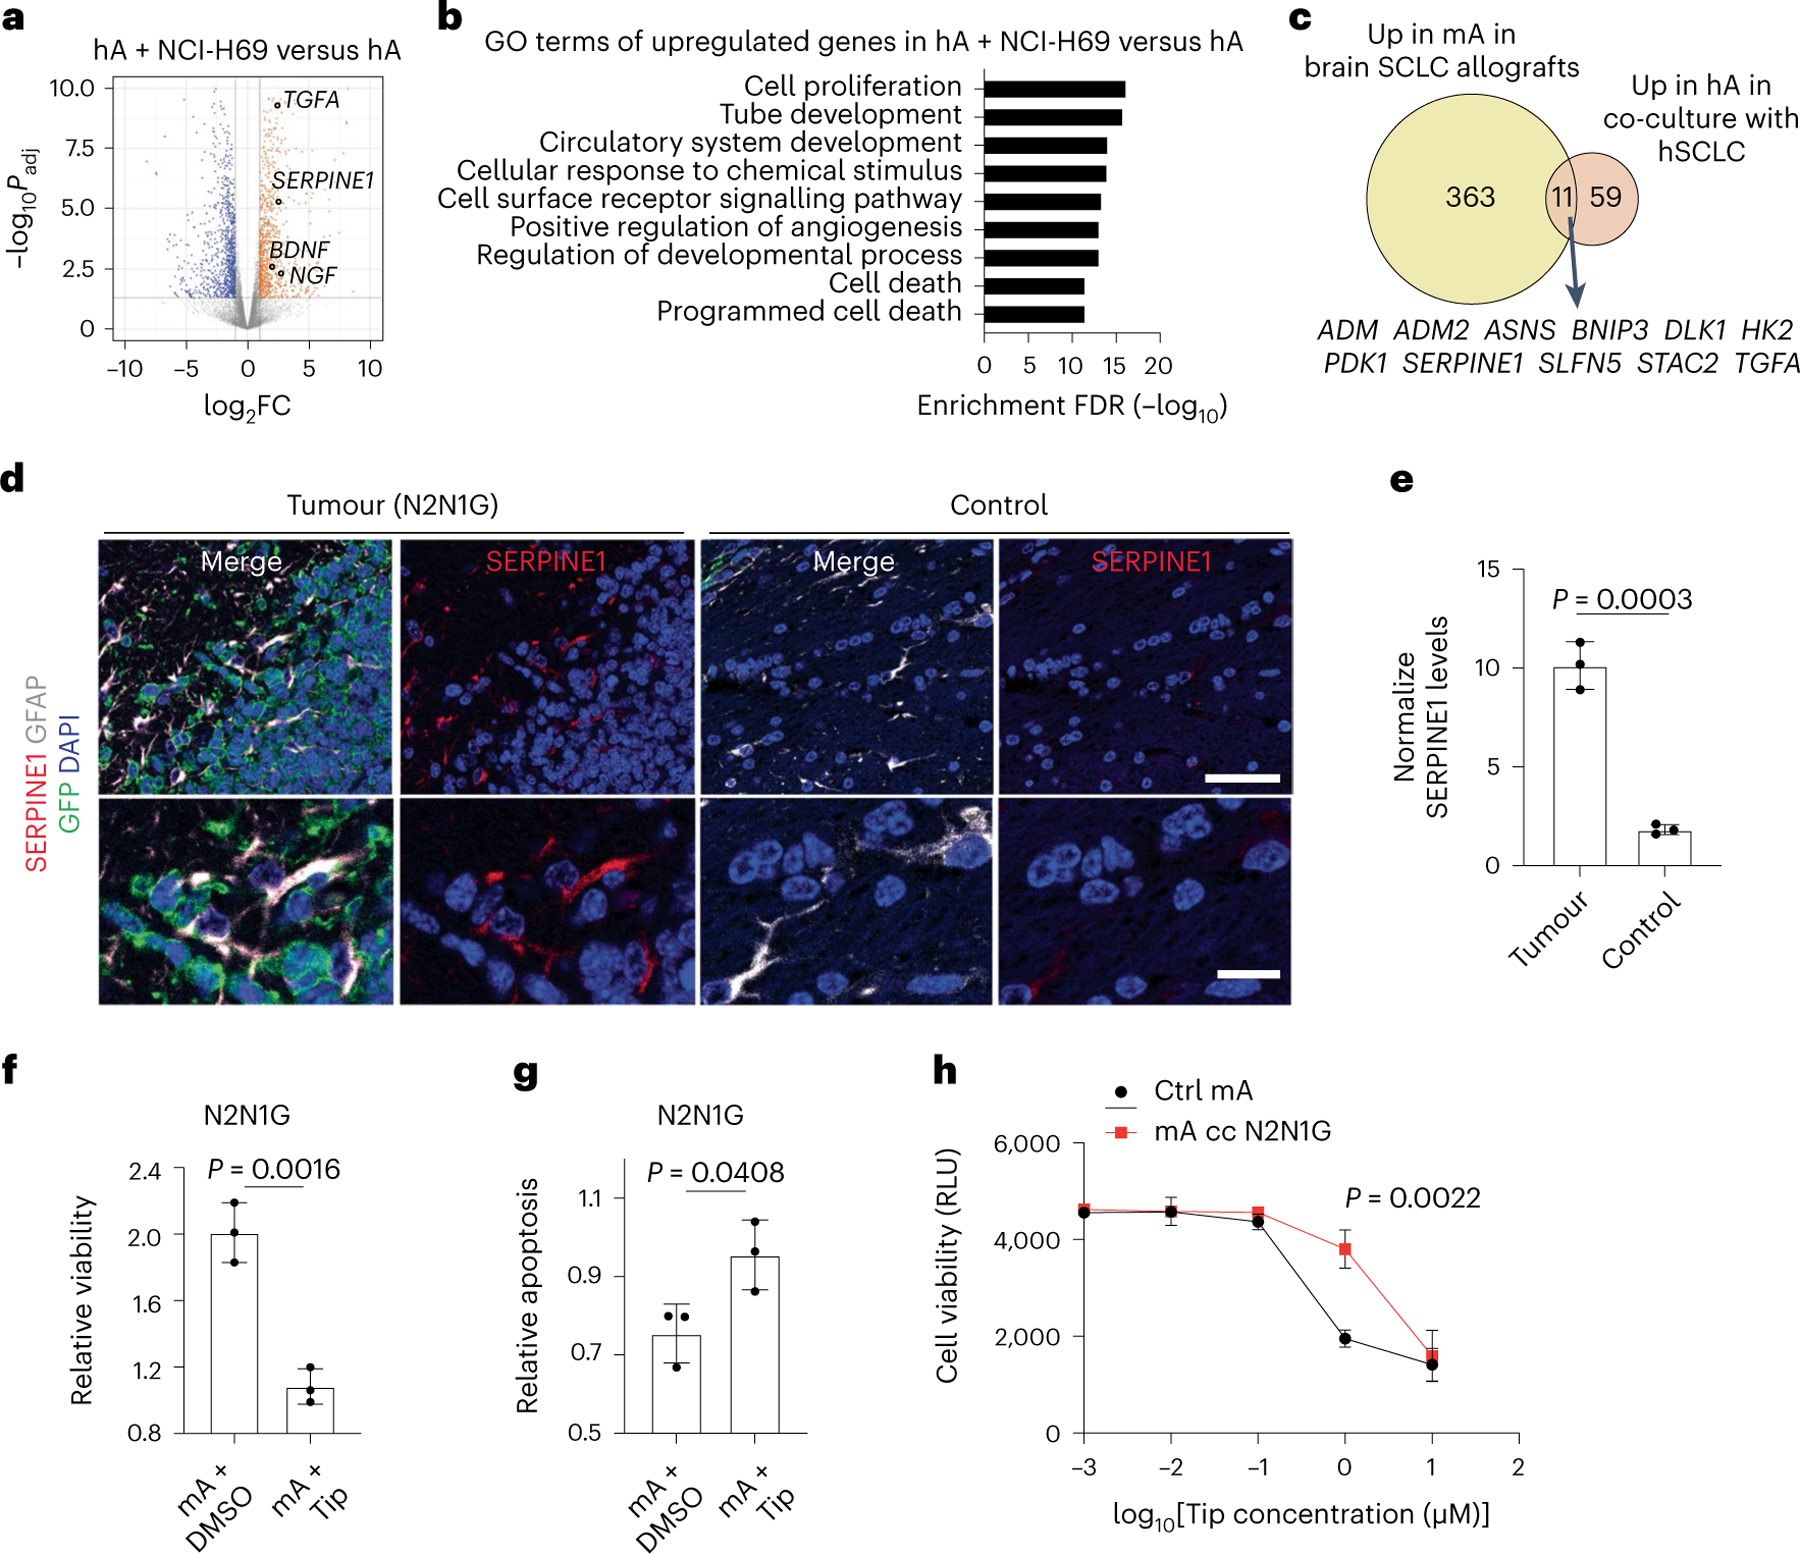
Fig. 7 |. Astrocytes reactivated by SCLC cells upregulate anti-apoptotic programmes.

a, Volcano plot showing differentially expressed genes in human astrocytes co-cultured with NCI-H69 cells compared to human astrocytes cultured alone. Selected genes are indicated. Padj values calculated by the Wald test with correction for multiple comparison. b, GO enrichment (top 9) for genes upregulated in human astrocytes co-cultured with NCI-H69 cells. c, Overlap between upregulated genes in tumour-associated mouse astrocytes and human astrocytes co-cultured with SCLC cells. The 11 overlapping genes are indicated. d, Representative immunofluorescence staining images of GFAP and SERPINE1 in a brain tumour from N2N1G mouse SCLC cells. Blue, DAPI DNA stain. Scale bar, 50 μm (top) and 10 μm (bottom). e, Quantification of SERPINE1 immunofluorescence intensity in astrocytes normalized to normal adult brain region from images as in (d) (N2N1G, n = 3 tumours). f,g, Relative viability (f) and apoptosis (g) of N2N1G cells cultured with mouse astrocytes with or without the SERPIN1 inhibitor tiplaxtinin (Tip, 5 μM) compared to N2N1G cells cultured alone. n = 3 independent experiments. h, Dose–response (measured cell viability via Alamar blue) of tiplaxtinin on mouse astrocytes. Black, naive astrocytes. Red, astrocytes reactivated by N2N1G cells. RLU, relative luminescence unit. Data are mean ± s.d. P values by two-sided t-test when comparing two groups and one-way ANOVA when comparing three or more groups; P value calculated by two-way ANOVA in h.
