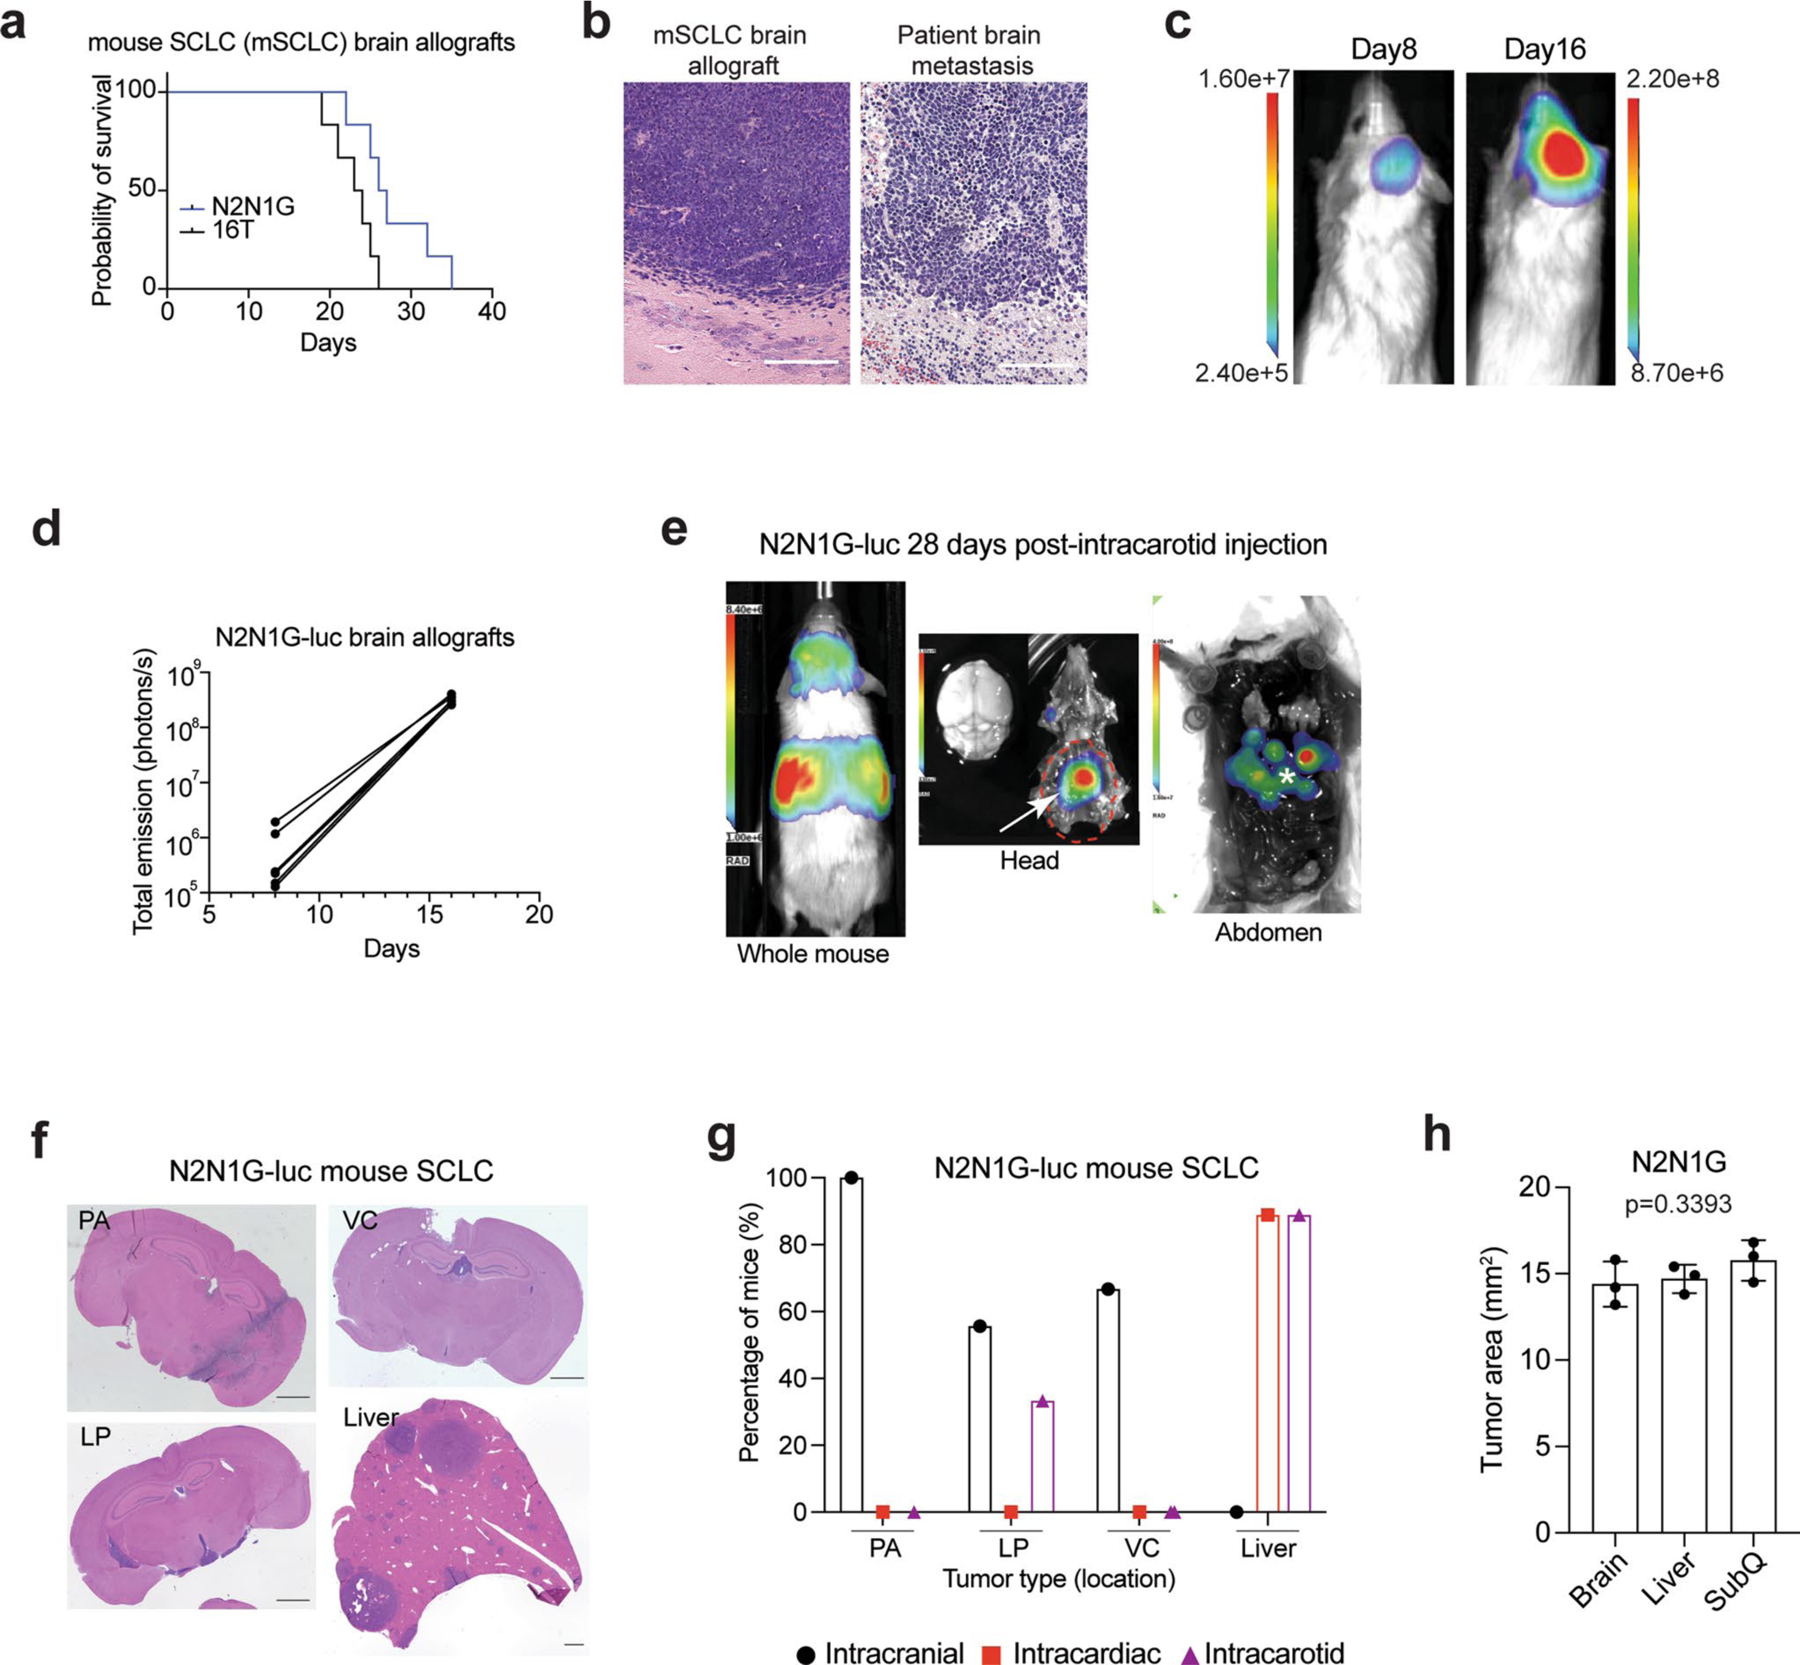
Extended Data Fig. 1 |. Modeling SCLC brain metastasis in mice following injection of mouse SCLC cells.

a. Survival data of NSG mice with N2N1G and 16 T mouse SCLC brain allografts (n = 6). b. Representative images of hematoxylin and eosin (H&E) counterstained-brain sections for the N2N1G mouse brain allografts and for human SCLC brain metastases. Similar to human tumors, mouse tumors display stippled chromatin, nuclear molding, scant cytoplasm, and frequent mitotic figures and apoptosis. Dark purple: tumor. Scale, 200 μm. Similar results were observed from 3 biologically independent samples. c. Representative images of luciferase (luc) bioluminescence activity from growing tumors after injection of N2N1G cells stably expressing luciferase (N2N1G-luc). d. Quantification of luciferase bioluminescence signal from 5 mice as in (c). e. Representative image of luciferase bioluminescence following intracarotid injection of N2N1G-luc cells (28 days). White arrow: subcranial tumor; asterisk: liver metastases. f. Representative images of hematoxylin and eosin (H&E) counterstained-brain and liver sections with parenchymal (PA), leptomeningeal (LP), ventricular (VC) brain metastases and liver metastases following injections of N2N1G-luc cells. Scale bar, 1 mm. g. Quantification of (f) for intracranial, intracardiac, and intracarotid injections. n = 9 mice per approach. h. Quantification of N2N1G tumors at different sites (n = 3 each); these tumors were used for analyses in Fig. 1b–d. Data show mean with SD. P value calculated by one-way ANOVA.
