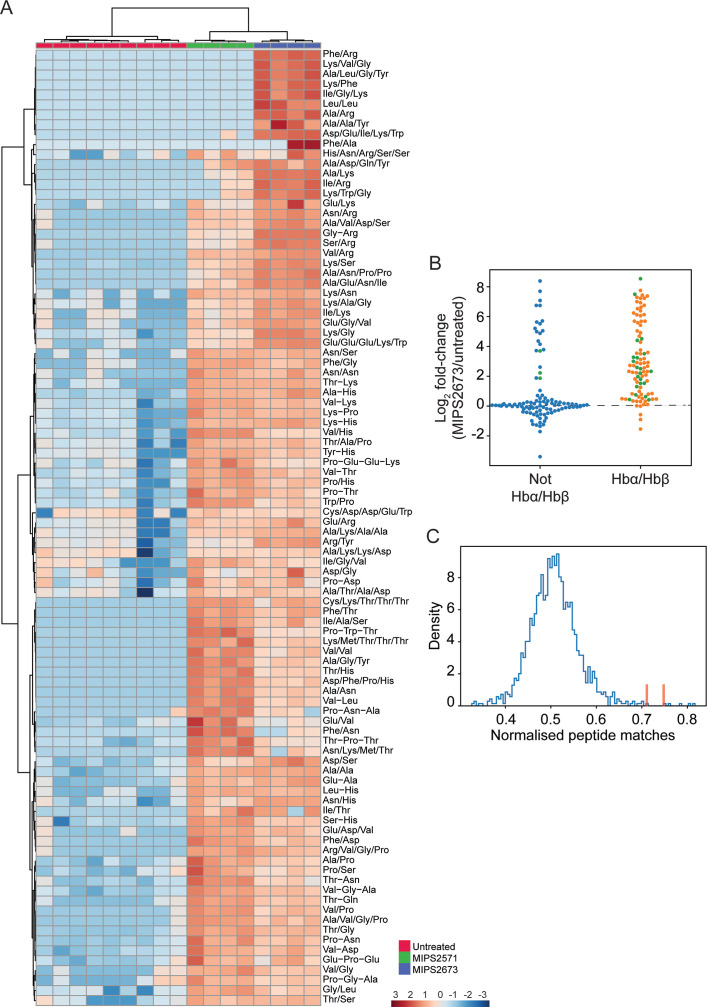
Figure 6. Targeted analysis of significantly dysregulated peptides (p<0.05) following treatment with 1 µM of MIPS2673 (PfA-M1 inhibitor) for 1 hr compared to MIPS2571 (PfA-M17 inhibitor) and DMSO control.
(A) Hierarchical clustering of the 97 peptides significantly dysregulated after treatment with MIPS2673 (fold-change >1.5 and p<0.05); four biological replicates for MIPS2673 and MIPS2571 (data from Edgar et al., 2022) and nine biological replicates for DMSO control. Vertical clustering displays similarities between samples, while horizontal clusters reveal the relative abundances (median normalised) of the 97 peptides. The color scale bar represents log2 (mean-centred and divided by the standard deviation of each variable) intensity values. Peptides with hyphen (-) notation indicate confirmed sequence by MS/MS. Peptides with slash (/) notation indicate putative amino acid composition (accurate mass), without confirmed sequence order. (B) Differential enrichment of all (201) putatively identified peptides that could (orange dots) or could not (blue dots) be derived from haemoglobin (Hb) α and β. Green dots are peptides that have MS/MS spectra and their sequences have been confirmed. (C) Histogram of the sequence similarity of ~4700 proteins present in P. falciparum infected red blood cells to the peptides significantly dysregulated by treatment with MIPS2673. Here, sequence similarity is quantified as the number of times a significantly perturbed peptide matches a given protein, normalised by protein length. The Hb chains α and β are highlighted in red bars.


