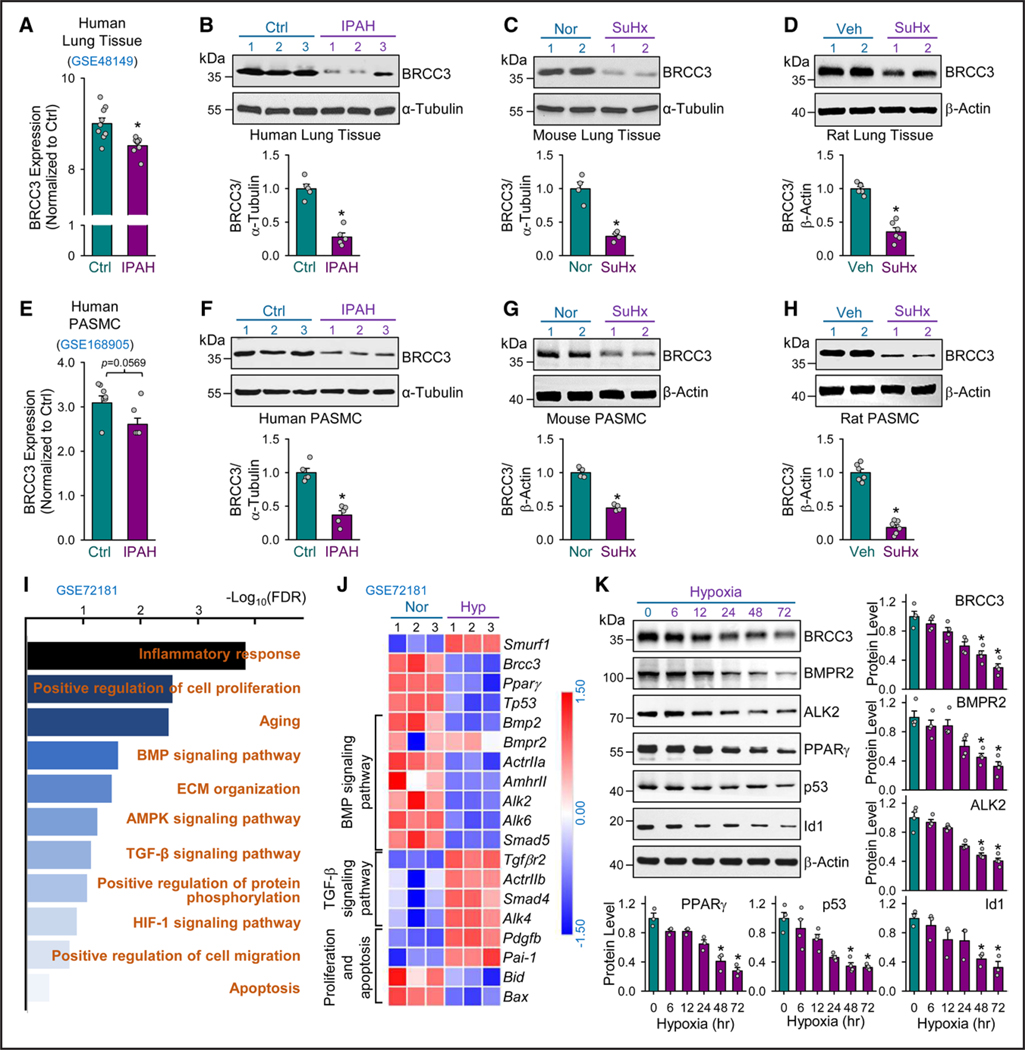
Figure 1. BRCC3 is decreased in human and rodent PH.
A, Bioinformatics analysis of GEO RNA-seq data (GES48149) for BRCC3 levels in human lung tissues from patients with idiopathic pulmonary artery hypertension (IPAH; n=8) and controls without IPAH (n=9). Western blot analysis of BRCC3 levels in lung tissues from patients with IPAH and nondiseased tissues (B); mouse models with experimental PH induced by 10% O2 with subcutaneous injection of SU5416 (SuHx) and control mice under normoxia (C); and rat models with SuHx-induced PH vs controls (D). E, Analysis of GEO RNA-seq data (GES168905) for BRCC3 expression level in human pulmonary arterial smooth muscle cells (PASMCs) from patients with or without IPAH. Western blot analysis of BRCC3 levels in lung PASMCs isolated from IPAH and control individuals (F); SuHx-induced PH mice and control mice (G); and SuHx-induced PH rat models and control rats (H). I, Gene Ontology (GO) enrichment analysis of GSE72181 using DAVID for the top upregulated and downregulated pathways (fold change in expression >1.5 or < −1.5; P<0.05) in PASMCs under normoxia vs hypoxia and plotted as –log(P value) [–Log10(P)]. J, Heatmap generated from GSE72181 revealing differentially expressed genes involved in the BMP pathway (18 differentially expressed genes), TGF-β pathway (16 differentially expressed genes), proliferation (25 differentially expressed genes), and apoptosis (16 differentially expressed genes) in PASMCs under normoxia or hypoxia. K, PASMCs cultured under hypoxia for 6, 12, 24, 48, or 72 hours. Western blot analysis of protein levels of BRCC3, BMPR2, ALK2, PPARγ, p53, and Id1 with those of β-actin as loading controls. Data in A through H and K are mean±SEM from 3 to 9 independent experiments. For data with normal distribution (A, D, and H), statistical significance was determined by 2-tailed Student t test with Welch correction between 2 indicated groups. Nonnormally distributed data in B, C, and E through G were analyzed by Mann-Whitney U test between 2 indicated groups. Nonnormally distributed data in K were analyzed by the Kruskal-Wallis test between multiple groups. *P<0.05 vs control patients (Ctrl) or normoxia (Nor) or vehicle (Veh) or 0 hour. ALK2 indicates activin receptor-like kinase-2; BMP, bone morphogenetic protein; BMPR2, bone morphogenetic protein type 2 receptor; BRCC3, BRCA1/BRCA2-containing complex subunit 3; GEO, Gene Expression Omnibus; PH, pulmonary hypertension; RNA-seq, RNA sequencing; and TGF-β, transforming growth factor-β.

