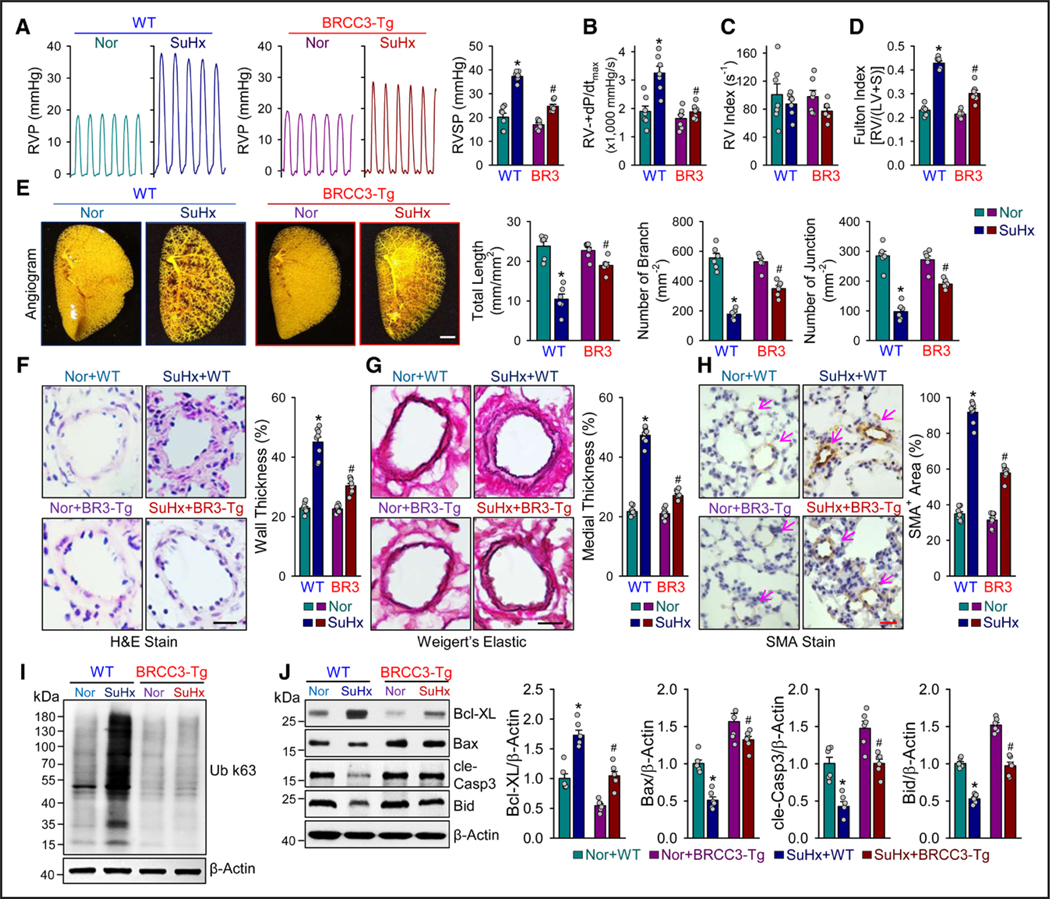
Figure 3. BRCC3 overexpression in PASMCs attenuates experimental PH.

A through E, SM22α-BRCC3-Tg mice and wild-type (WT) littermates were subjected to normoxia, or 10% O2 with subcutaneous injection of SU5416 at 20 mg/kg/week (SuHx) to induce PH. Mice in the WT+Nor, WT+SuHx, BRCC3-Tg+Nor, and BRCC3-Tg+SuHx groups were euthanized. A, Representative records of right ventricular pressure (RVP) and summarized RV systolic pressure (RVSP), summarized values of RV±dp/dtmax (B), RV index (C), Fulton index (ratio of weight of right ventricle [RV] to that of left ventricle [LV] and septum [S] [RV/LV+S]; D), and angiography of pulmonary vasculature (E). Summarized data (mean±SEM; n=6 lungs) showing the total length of branches, number of branches, and number of junctions of the left lungs. Scale bar=50 mm. F, Hematoxylin and eosin (H&E) staining of pulmonary arteries. Scale bar=20 μm. G, Weigert elastic staining revealing the elastic fibers (dark blue) and collagen fibers (red). The area between the 2 layers of elastic fibers is the media layer, whereas the adventitial layer is indicated by the stained collagen fibers in red. Scale bar=20 μm. H, Immunohistochemical staining of SMAα. Summarized data (mean±SEM) showing the pulmonary arterial wall thickness and PASMC hypertrophy. Scale bar=20 μm. I, Western blot analysis of anti-Ub K63 to detect protein ubiquitination (n=3). J, Western blot analysis of Bcl-XL, Bax, cle-Casp3, Bid, and β-actin. Data in A through H and J are mean±SEM (6–8 mice per group). Normally distributed data in A through H and J were analyzed by 2-way ANOVA between multiple groups. *P<0.05 vs WT+Nor; #P<0.05 vs WT+SuHx. BRCC3 indicates BRCA1/BRCA2-containing complex subunit 3; cle-Casp3, cleaved caspase 3; PASMC, pulmonary arterial smooth muscle cell; and PH, pulmonary hypertension.
