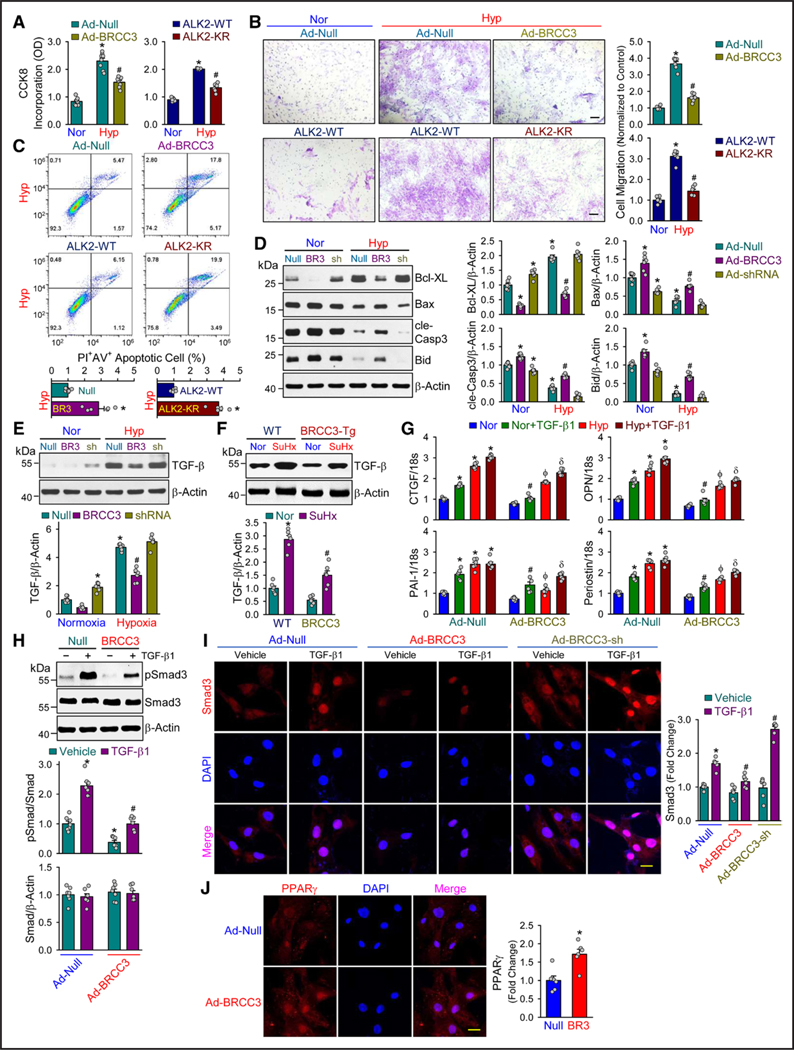
Figure 6. BRCC3 regulates PASMC phenotype.
A through C, Rat PASMCs were transfected with Ad-Null or Ad-BRCC3 for 48 hours and transfected with plasmid encoding ALK2-WT or ALK2-KR (1 μg/mL), then exposed to normoxia or hypoxia for an additional 48 hours. The harvested cells were subjected to cell counting Kit-8 (CCK-8) assay (A), Trans-well assay (B), and flow cytometry assays. Scale bar=100 μm. (C). D and E, PASMCs were transfected with Ad-Null, Ad-BRCC3, or Ad-BRCC3 shRNA for 24 hours, then cultured under normoxia or hypoxia for 48 hours. Western blot analysis of protein levels of Bcl-XL, Bax, cle-Casp3, Bid, and β-actin (D) and TGF-β (E). F, Lung tissues from WT or BRCC3-Tg mice subjected to normoxia or SuHx were analyzed by Western blot using anti–TGF-β. G through J, PASMCs were transfected with Ad-Null or Ad-BRCC3 for 24 hours, then cultured under normoxia or hypoxia for 48 hours and treated with vehicle or TGF-β (5 ng/mL) for 24 hours before harvesting. G, The CTGF, OPN, PAI-1, and Periostin mRNAs were quantified by quantitative polymerase chain reaction. H, Western blot analysis of pSmad3. I, Immunofluorescence staining analysis of Smad3 nuclear entry. Scale bar=50 μm. J, Immunofluorescence staining of PPARγ nuclear entry. Scale bar=50 μm. Data in A through J are mean±SEM from 6 to 8 independent experiments. Normally distributed data in were analyzed by 1-way ANOVA (A and B) and 2-way ANOVA (D through I) between multiple groups. Normally distributed data in C and J were analyzed by 2-tailed Student t test with Welch correction between 2 indicated groups. Data in A through C, *P<0.05 vs Nor+Ad-Null or Nor+ALK2-WT, #P<0.05 vs Hyp+Ad-Null or Hyp+ALK2-WT. Data in D and E, *P<0.05 vs Nor+Ad-Null, #P<0.05 vs Hyp+Ad-Null. Data in F, *P<0.05 vs WT+Nor, #P<0.05 vs WT+SuHx. Data in G through I, *P<0.05 vs Nor+Ad-Null, #P<0.05 vs Nor+Ad-Null+TGF-β1, ϕP<0.05 vs Hyp+Ad-Null, δP<0.05 vs Hyp+Ad-Null+TGF-β1. BRCC3 indicates BRCA1/BRCA2-containing complex subunit 3; cle-Casp3, cleaved caspase 3; CTGF, connective tissue growth factor; OPN, osteopontin; PAI-1, plasminogen activator inhibitor-1; PASMC, pulmonary arterial smooth muscle cell; SuHx, Sugen5416/hypoxia; TGF-β, transforming growth factor-β; and WT, wild-type.

