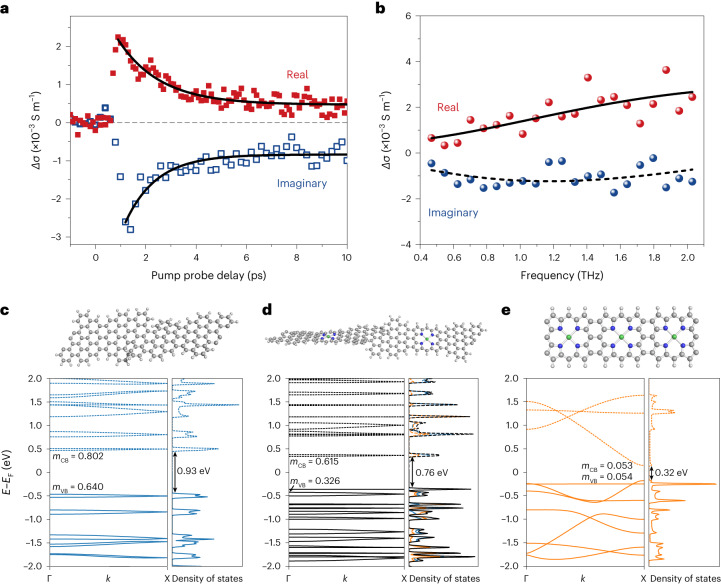
Fig. 5. Ultrafast photoconductivity by terahertz spectroscopy and band structure.
a, Time-resolved complex photoconductivity dynamics of PGNRb measured in 1,2,4-trichlorobenzene (0.33 mg ml–1) at room temperature. The solid lines represent fitted photoconductivity dynamics by a single-exponential decay (+long-lived offset) with the same decay time of 1.5 ± 0.2 ps for both the real and imaginary parts. b, Frequency-resolved terahertz photoconductivity of PGNRb measured at tp = 2 ps. The data are fitted by the Drude–Smith model described in the main text. c–e, Energy bands as a function of the wavevector k and density of states of GNR (c), PGNR (d) and porphyrin ribbon (e). The energy band gap (Eg), valence and conduction bands, and effective mass (mCB and mVB) are shown; energies are reported relative to the intrinsic Fermi level (EF). The colour scale for PGNR represents the proportion of electron density on GNR (blue) or porphyrin (orange); occupied (unoccupied) levels are shown as solid (dotted) lines.

